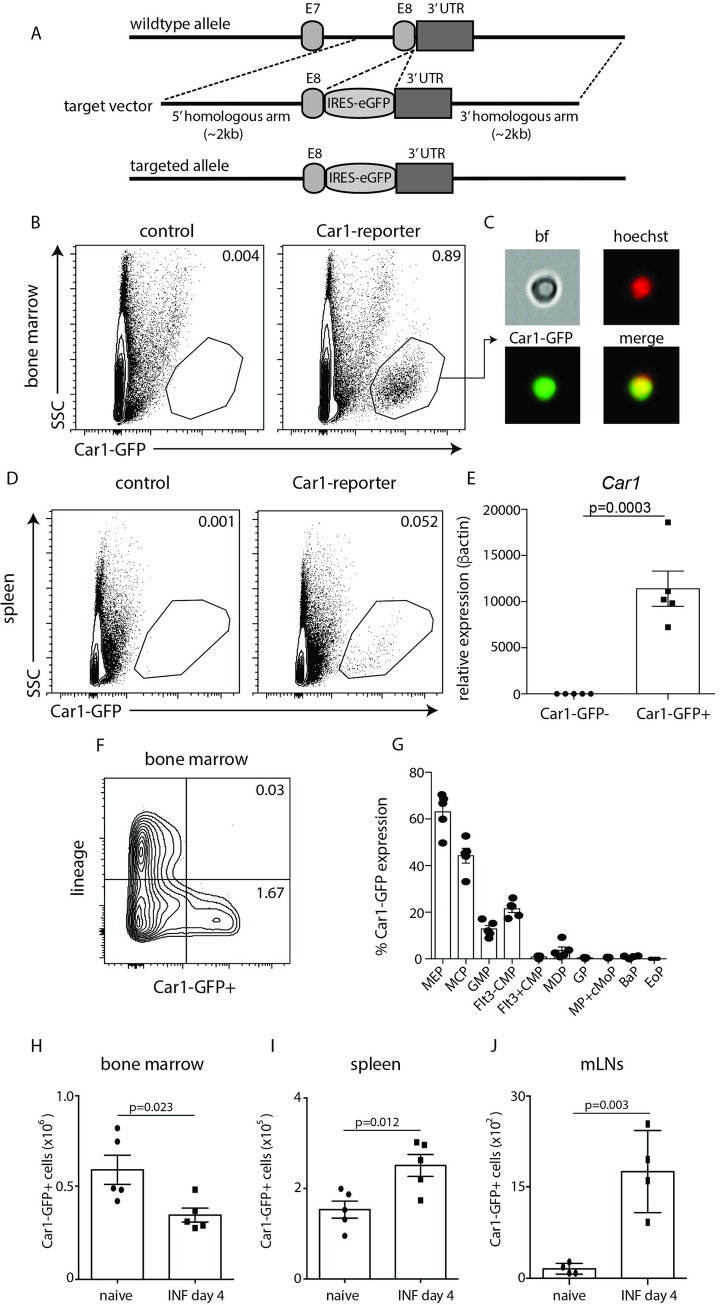
Fig 2. Car1-expressing HPCs are found in the gut-associated lymphoid tissue post-Trichinella infection.
(A), Schematic illustrating targeting strategy and placement of IRES following exon 8 of Car1. Flow cytometric analysis of (B) bone marrow-resident cells or (D) splenic cells from control or Car1-GFP+/+ mice illustrating Car1-GFP expression. (C), AMNIS imaging flow cytometry illustrating Car1-GFP expression from bone marrow-resident cells. (E), Car1 expression levels within sort-purified lineage- GFP- and lineage- GFP+ cells from the bone marrow were evaluated by RT-PCR. (F), Car1-GFP expression within lineage- and lineage+ compartments in the bone marrow was determined by flow cytometric analysis. (G), Car1-GFP expression by bone marrow-resident MEPs, MCPs, Flt3-CMPs, Flt3+CMPs MDPs, GPs, MP+cMoPs, BaPs and EoPs was evaluted. Car1-GFP+ cells were quantified in the (H) bone marrow, (I) spleen and (J) mesenteric lymph nodes (MLNs) on day 4 post-Trichinella infection. (A, B, D-J), Representative of at least 3 separate experiments. (C), Representative picture taken from a single experiment analyzing thousands of cells bf = bright field.

