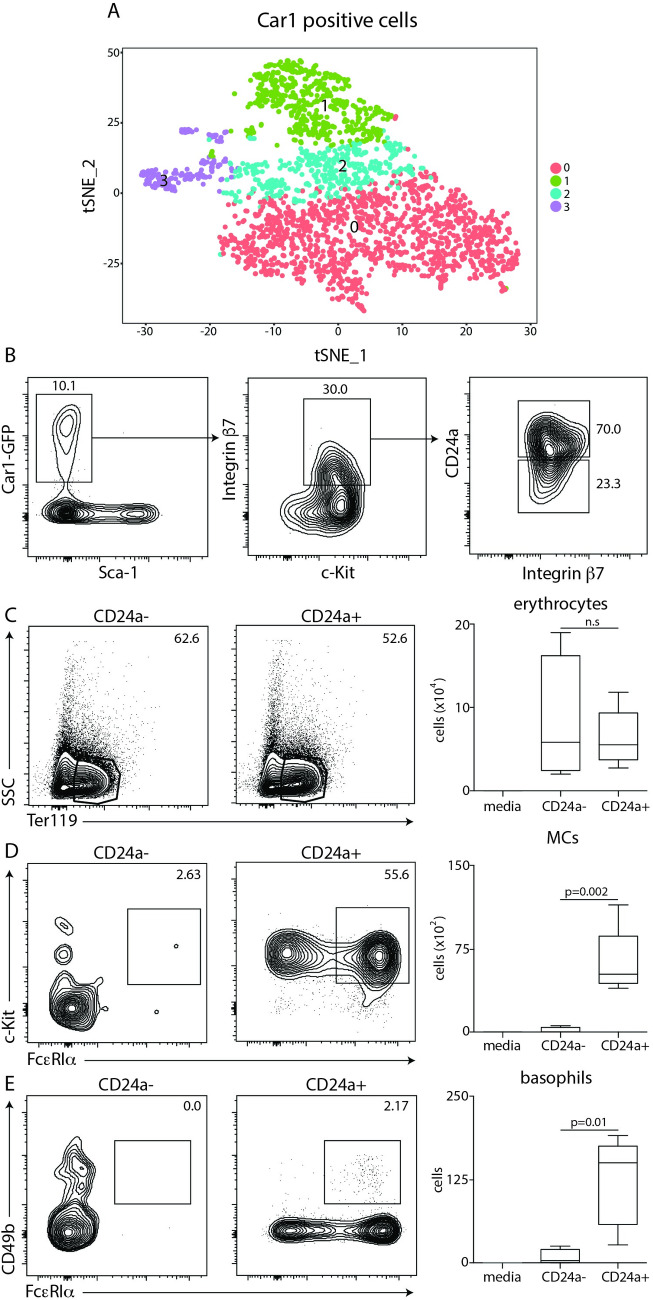
Fig 5. CD24a expression distinguishes erythrocyte potential from mast cell-erythrocyte potential within Car1-GFP positive cells.
(A), TSNE plot illustrating defined clusters of cells generated by single cell RNA-seq of live CD45+ Car1-GFP+ cells sort-purified from the bone marrow of naïve mice. (B), Plots illustrating gating strategy used to fractionate bone marrow-resident Car1-GFP+ cells. Car1-GFP+ c-Kit+ β7+ CD24a- or Car1-GFP+ c-Kit+ β7+ CD24a+ cells were sort-purified from the bone marrow of mice and seeded into MethoCult and the percentage and total numbers of (C) erythrocytes, (D) mast cells (MCs) and (E) basophils were evaluated by flow cytometric analysis post-culture. (B-E), Results are representative of at least 3 separate experiments. Statistical analysis performed using a Student’s t-test.

