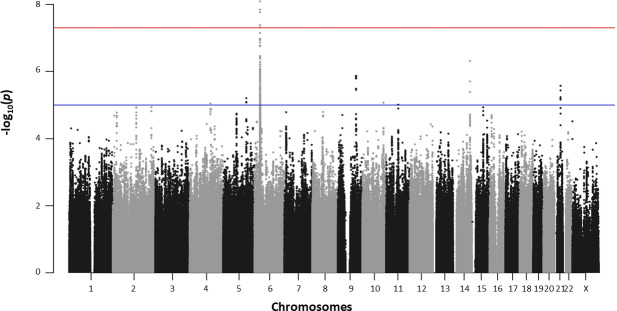
Fig 1. Manhattan plot of the results for association with leprosy per se in the family-based GWAS.
Manhattan plot showing results of the family-based genome-wide association study of leprosy per se in 622 affected offspring, for 5,607,170 variants. The–log10(p-value) for each variant (y-axis) is plotted according to its chromosomal position (x-axis, build hg19). The red and blue lines indicate the genome-wide significance (5.0x10⁻⁸) and suggestive (10−5) thresholds, respectively.

