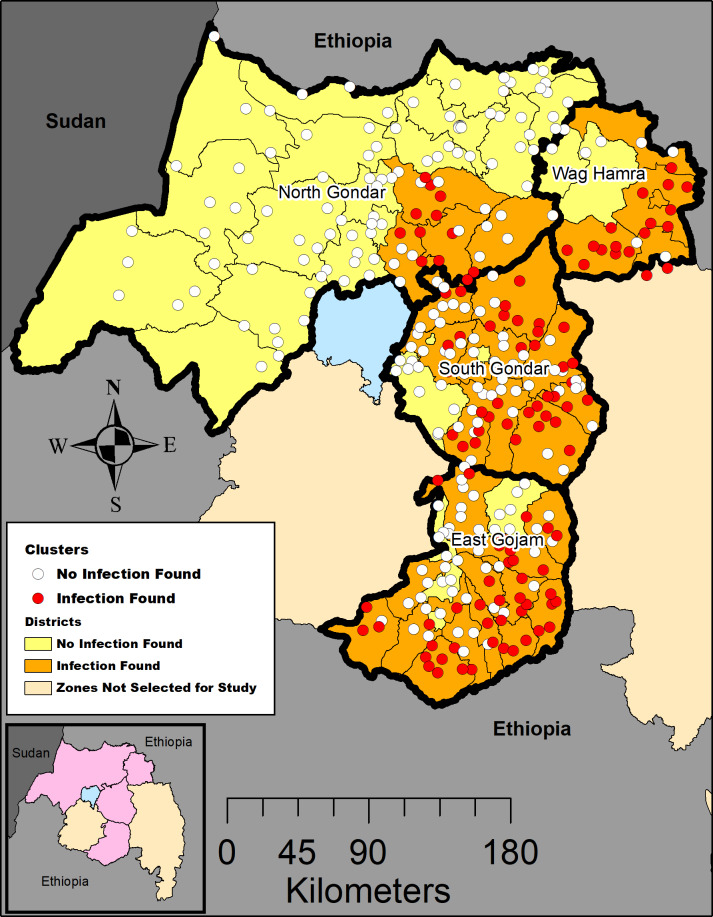
Fig 1. Location of surveyed clusters and clusters with positive sample among 4 administrative zones of Amhara, Ethiopia, 2011–2015.
Map created in ArcGIS 10.6 (ESRI, Redlands, CA) using a customized shapefile originally sourced from the GADM database (gadm.org). Inset map: Amhara region, zones included in this study are shaded in pink.

