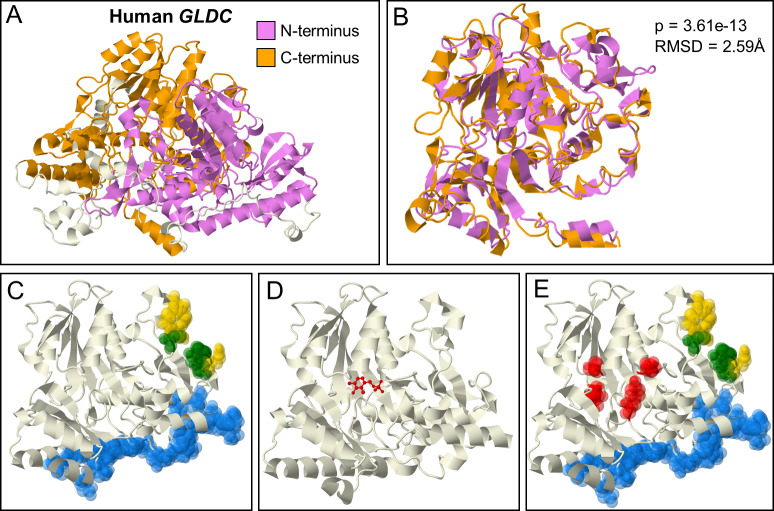
Fig 3. GLDC N-terminal Structural Homology and Function.
[A] Structurally homologous regions of the N- and C- termini respectively shown in purple and orange, respectively. [B] Relative alignment of the N- and C-terminal regions shown in [A]. FATCAT alignment gives an RMSD of 2.59 Å and a p-value of 3.61e-13. [C] Functional regions predicted based on evolutionary conservation in the N-terminus: tunnel, yellow; active site, green, and the dimerization interface, blue. [D] I-Tasser COFACTOR predicted PLP binding site in the N-terminus (PLP shown in red), providing a rationale for the presence of [E] a high incidence of NKH disease mutations in region shown in red.

