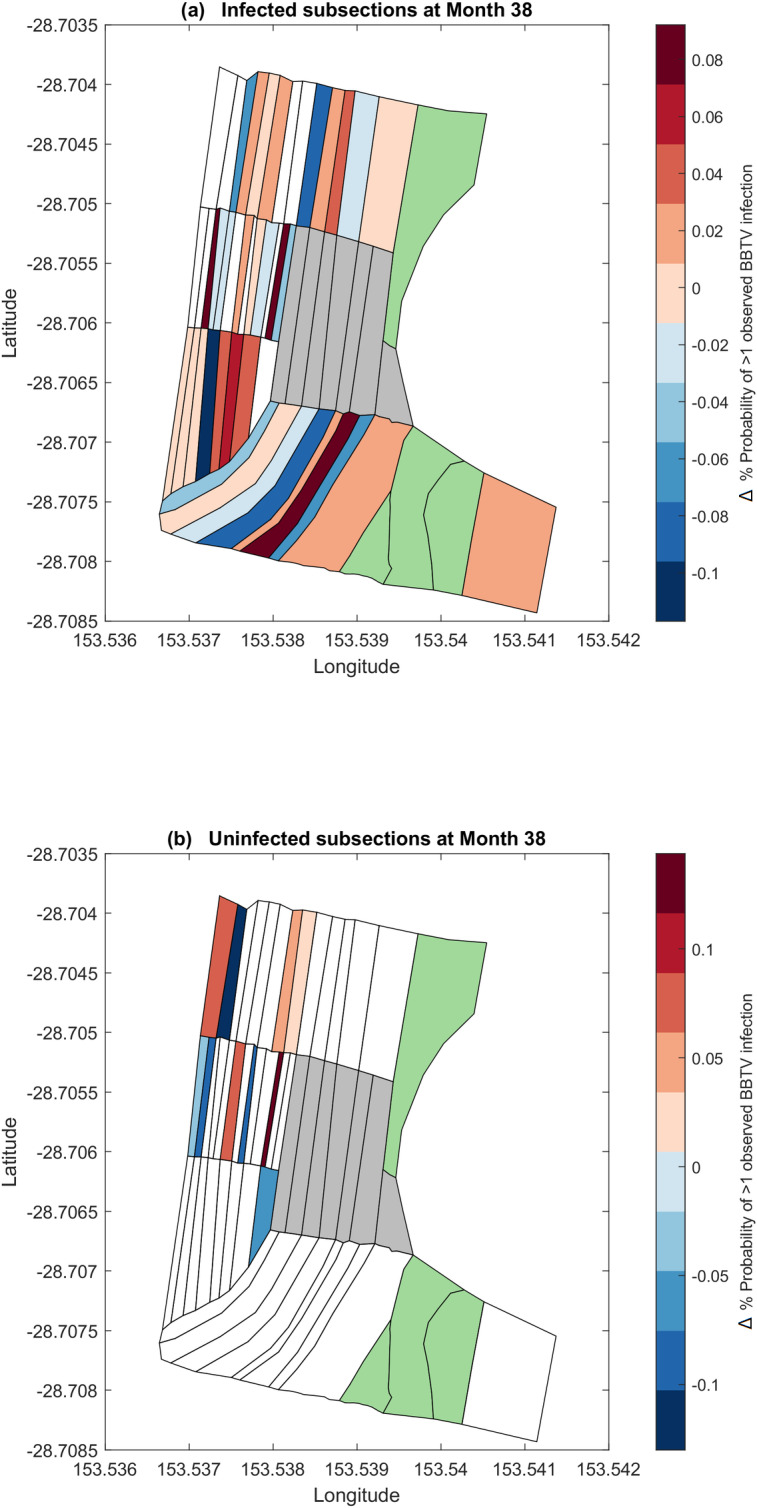
Fig 11. 1-month discrete-space posterior forecast of node infectivity.

(a) Posterior probability of node infection for previously infected nodes. (b) Posterior probability of node infection for previously uninfected nodes. Subsections highlighted green indicate nodes not planted with bananas. Subsections highlighted grey indicate nodes that have been ‘cleared’ according to the simulation.
