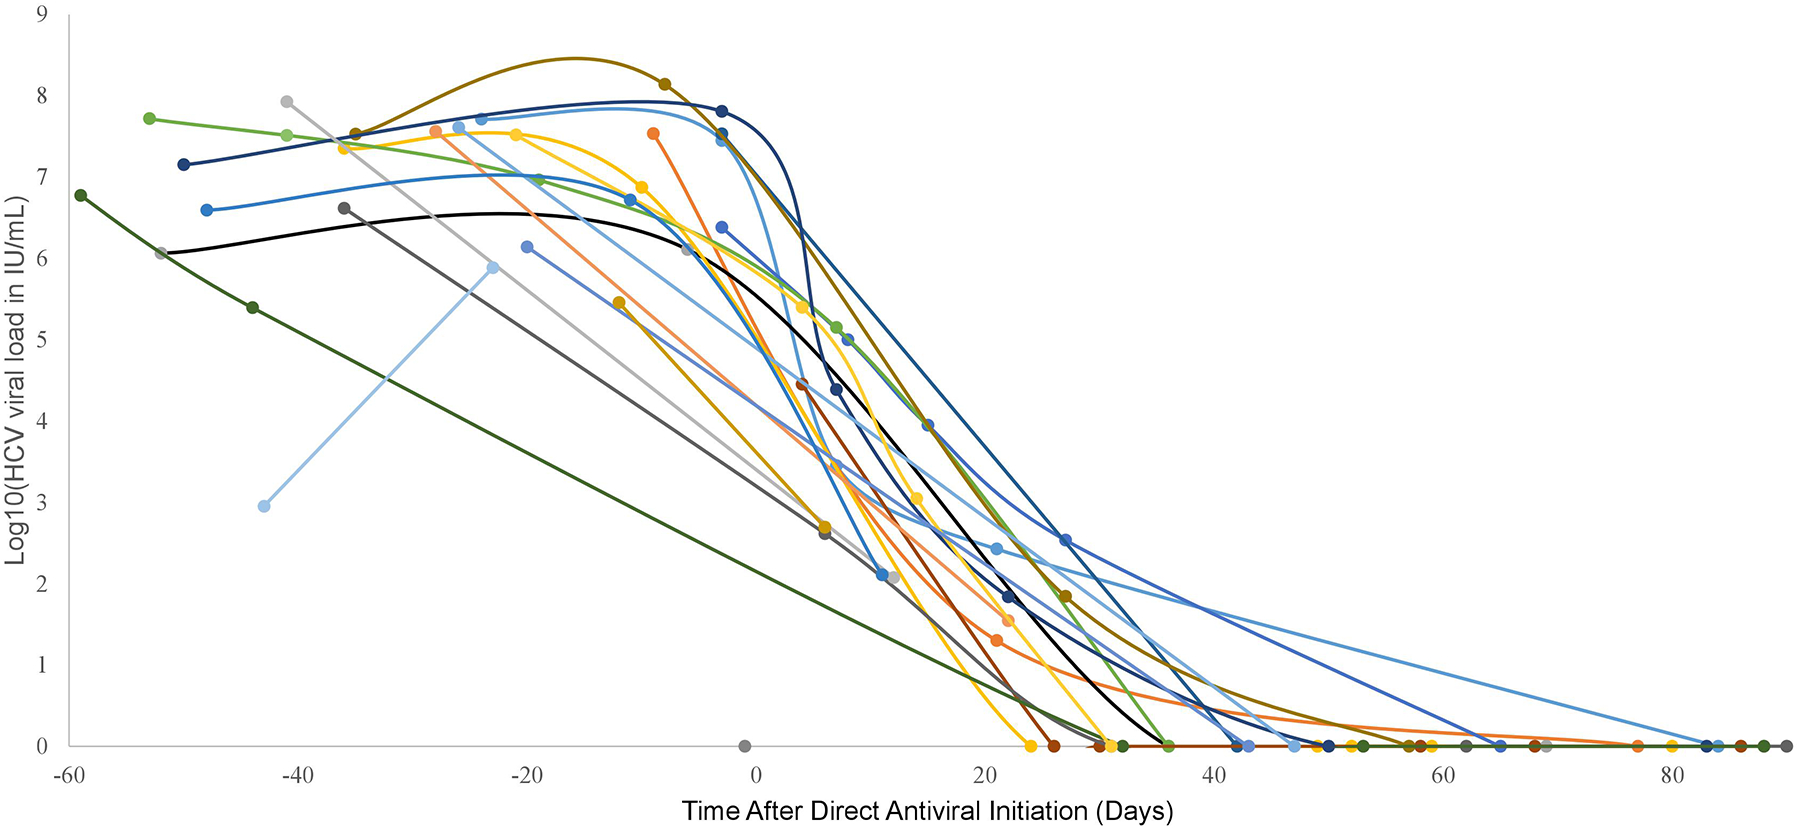
Figure 1: Viral Load for Each Patient Versus Time After Direct Antiviral Initiation.

Only the first 90 days after initiation of antiviral therapy is shown for each patient. Each series of dots connected by lines represents the viral load trend for a given patient treated with DAA. The above graph contains the 21 patients treated with DAA; 4 patients were not infected post-transplant thus never started DAA and 1 patient died prior to DAA treatment. Abbreviations: hepatitis C virus (HCV), international units per milliliter (lll/mL), direct-acting antiviral (DAA)
