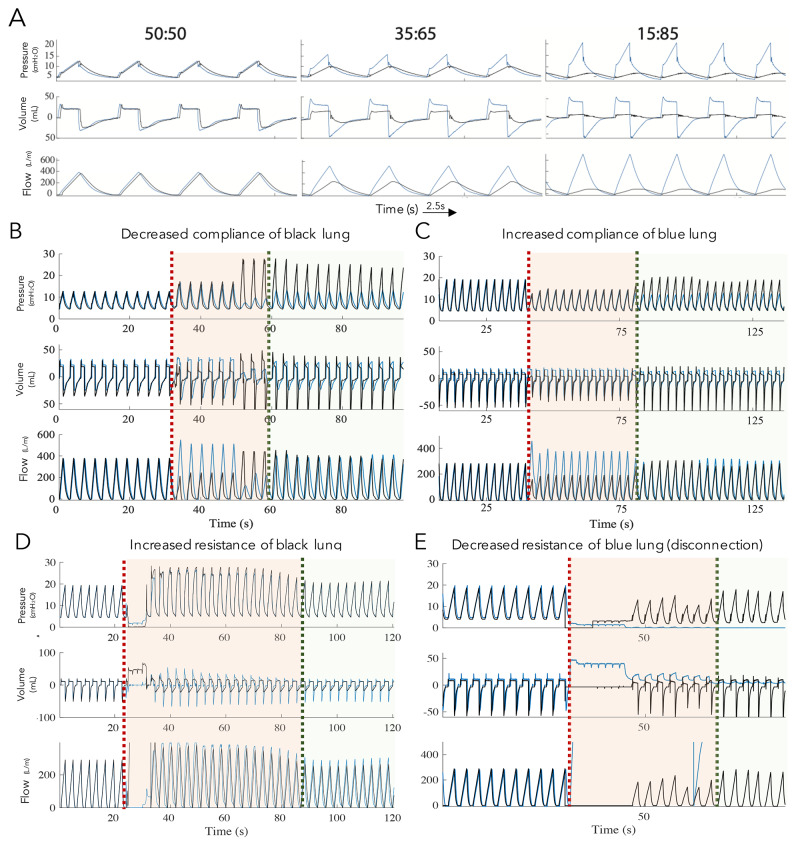
Fig. 2.
Individualized ventilation and management of patient interdependence using artificial test lungs. (A) Pressure, flow, and tidal volume waveforms illustrating three settings of differential tidal volume (VT) for two test lungs (blue, black) using closed-circuit ventilation. The ratio (50:50, 35:65, 15:85) refers to the VT of the black:blue lungs. Pressure, volume, and flow in both lungs upon (B) decreased compliance in one lung (black) and (C) increased compliance in the other lung (blue). The orange dotted line indicates decrease or increase in compliance. The green dotted line indicates return of baseline ventilation parameters upon titration of the valves. Pressure, volume, and flow in both lungs upon (D) increased resistance in one lung (black) and (E) decreased resistance in the other lung (blue). Orange dotted line indicates increase or decrease in resistance. Green dotted line indicates return of baseline ventilation parameters upon titration of the valves. Waveforms from each lung are slightly offset to enable visualization.

