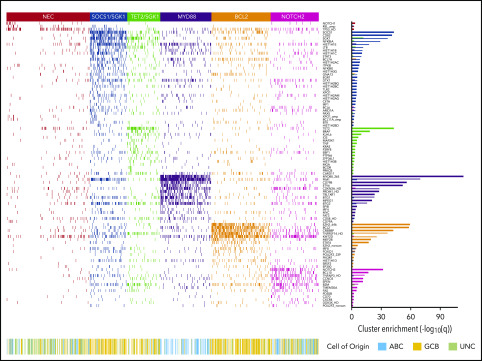
Figure 1.
Heat map of characteristic mutations from each of the 6 genetic clusters that were identified by using the Akaike information criterion in the analysis cohort (n = 928). Distinct clusters are identified by color. Along the bottom of the figure, the color strip shows the corresponding cell-of-origin classification for each patient. The panel on the right-hand side shows the enrichment for mutations within each cluster, with a logarithmic q-value scale. Only those mutations are shown that are identified as significantly enriched for the given group, as determined by a Benjamini-Hochberg adjusted q < 0.05 from a χ2 test of independence. “HD” indicates the homozygous deletion or a mutation in this gene; “noncan” denotes a non-canonical mutation; and “amp” indicates an amplification. For cell-of-origin, UNC represents the unclassified group.

