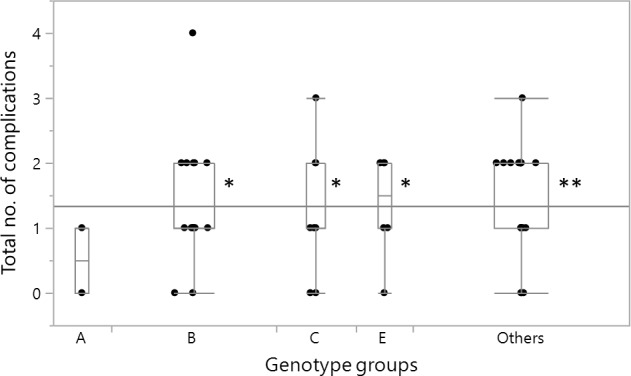
Figure 1.

Box plot showing the distribution of the combined microangiopathic and macroangiopathic complications in the FN3K genotype groups. The total number of complications per patient includes the presence of at least one of the following: cerebral macroangiopathy, peripheral artery disease, ischemic heart disease, retinopathy, and microalbuminuria. The Kruskal-Wallis test indicated a statistically significant difference among the genotype groups (p=0.0306). **p<0.01, *p<0.05 post hoc analysis versus genotype group A. In the graph, the edges of the box indicate the 25th and 75th quantiles, including the middle 50% of the data; whiskers indicate the range of data, calculated as [upper quartile+1.5 (IQR)] and [lower quartile−1.5 (IQR)]; the continuous horizontal line is the overall arithmetical mean for all the data; the scattered points are single subject’s values. The width of each box is proportional to the number of cases in each group. FN3K, fructosamine-3-kinase.
