
Figure 2.
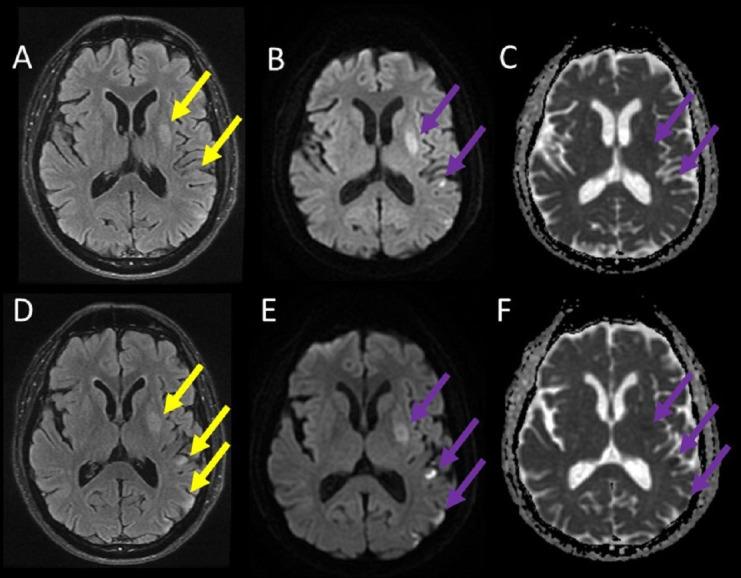
MRI of the brain. Images (A) and (D) demonstrate a hyperintensity signal on T2 sequences, affecting areas of the left parietal lobe and left basal ganglia (yellow arrows). Images (B) and (E) also demonstrate a hyperintensity signal on diffusion-weighted images (expected in acute cerebrovascular events) and respective hypointensity signal in the apparent diffusion coefficient images (C) and (F) (purple arrows).