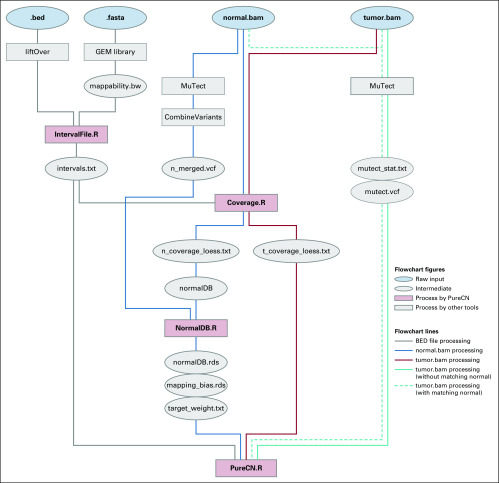
FIG A1.
Copy number alterations analysis workflow. Raw input data files and the intermediate/processed data files are depicted as blue and gray oval shapes, respectively. R scripts provided by PureCN are depicted by rose squares, and third-party tools are depicted by gray squares. Gray solid lines indicate how the target region information is processed. Blue and red solid lines describe how normal and tumor BAM files are processed, respectively. Dashed and solid teal lines show how germline single-nucleotide polymorphisms and somatic mutations were prepared with or without matched normal, respectively.

