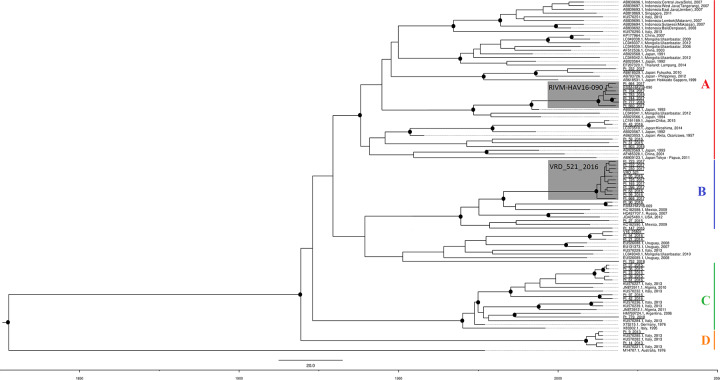
Fig 4. Bayesian Phylogenetic tree.
Bayesian Maximum Credibility (Bayesian MCC) phylogenetic tree, built on 46 459 nt-long VP1X2A junction sequences of genotype IA HAV genome. The model used was: mutation model General Time Reversible + G, strict clock model and Bayesian skyline demographic model (2lnBF > 10 for every comparison), tested through MCMC for at least 100*106 generations. All unique sequences, collected until October 2018 from Lazio region and classified as genotype IA, are included and sample names are underlined in the tree. The bar represents time coalescent in years and posterior probability values are greater than 80% (●). The tree also includes 53 sequences from GenBank (AB020564.1, AB020566.1, AB020567.1, AB020568.1, AB020569.1, AB618529.1, AB618531.1, AB623053.1, AB793726.1, AB819869.1, AB839692.1, AB839693.1, AB839694.1, AB839695.1, AB839696.1, AB839697.1, AB909123.1, AF485328.1, AF512536.1, EF207320.1, EU131373.1, EU526088.1, EU526089.1, HM769724.1, HQ437707.1, JN873911.1, JN873912.1, JQ425480.1, KC182588.1, KC182590.1, KP177964.1, KU570221.1, KU570227.1, KU570229.1, KU570232.1, KU570236.1, KU570239.1, KU570251.1, KU570282.1, KU570284.1, KU570285.1, KU570290.1, LC049337.1, LC049338.1, LC049339.1, LC049340.1, LC049341.1, LC049342.1, LC191189.1, LC373510.1, M14707.1, X75215.1, X83302.1), and the 4 sequences (VRD_521_2016 and RIVM-HAV16-90, RIVM-HAV16-69 and V16_25801). The bar represents time coalescent in years. Coloured lines on the tree marked clades in genotype IA, while the grey background highlights MSM clusters with RIVM-HAV16-090 and VRD_521_2016.

