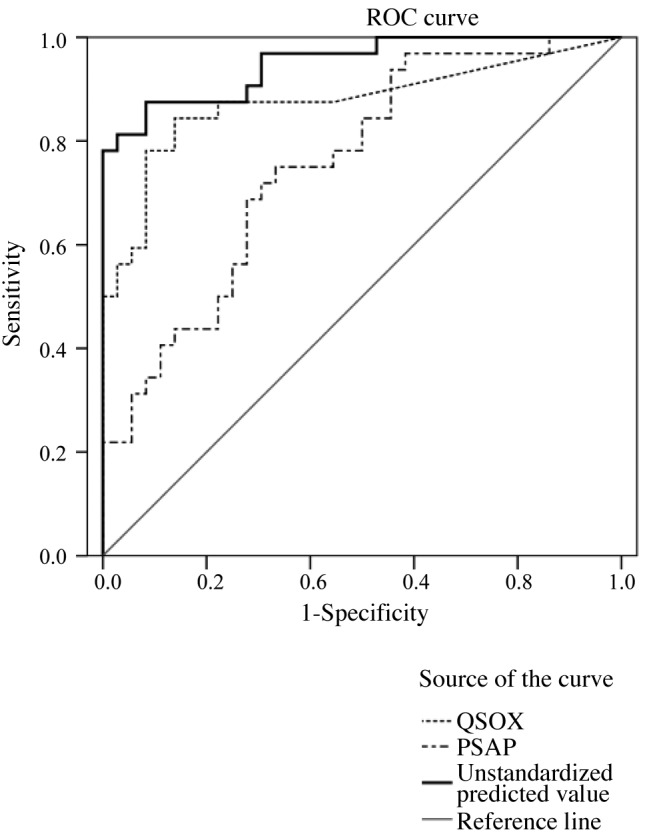
Figure 6. ROC curves of serum PSAP and QSOX1 concentrations. Individual and combined ROC curves in differentiating MPM patients (n=32) from asbestos-exposed healthy subjects (n=36) are shown. A logistic regression analysis was used to combine biomarker data.