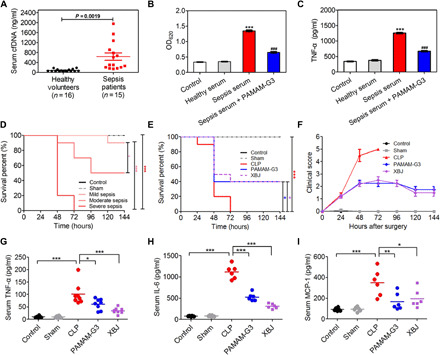
Fig. 1. PAMAM-G3 reduces the cfDNA-driven proinflammatory response in vitro and in CLP-induced severe sepsis.

(A) Serum levels of cfDNA in healthy volunteers (n = 16) and patients with sepsis (n = 15). Data are expressed as the means ± SEM, and differences were assessed with Student’s t test. (B) Activation of HEK-TLR9 reporter cells by either healthy human serum or sepsis patient serum in the absence or presence of PAMAM-G3 (10 μg/ml) for 24 hours. The corresponding embryonic alkaline phosphatase (SEAP) activity in supernatants from each group was determined with a QUANTI-Blue assay with optical density at 620 nm (OD620). (C) RAW 264.7 macrophages were stimulated with sepsis patient serum in the absence or presence of PAMAM-G3 (10 μg/ml) for 24 hours. Supernatants were assayed for TNF-α via enzyme-linked immunosorbent assay (ELISA). In (B) and (C), differences were assessed via one-way analysis of variance (ANOVA) with Tukey’s multiple comparison tests (***P < 0.001, compared with healthy serum; ###P < 0.05, compared with sepsis serum). The data are expressed as the means ± SEM. (D) The indicated BALB/c mice were subjected to CLP of different grades. Survival was monitored for 144 hours (n = 10 mice per group; *P < 0.05 and ***P < 0.001, Kaplan-Meier survival analysis). (E) High-grade CLP was performed on BALB/c mice, followed by intraperitoneal injection of PAMAM-G3 or Xuebijing (XBJ) (20 mg/kg) 12 hours before and 1 and 12 hours after surgery. Survival was monitored for 144 hours (n = 10 mice per group; *P < 0.05 and ***P < 0.001, Kaplan-Meier survival analysis). (F) Mice were monitored for 144 hours after CLP for clinical scoring. The clinical scoring of sepsis was defined according to a range from 0 (no symptoms) to 5 (loss of self-righting reflex). The data are expressed as the means ± SEM. (G to I) High-grade CLP was performed on BALB/c mice, followed by treatment as described in (E). The levels of the proinflammatory cytokines (G) TNF-α, (H) interleukin-6 (IL-6), and (I) monocyte chemoattractant protein-1 (MCP-1) were measured in the blood 24 hours after CLP. Differences were assessed via one-way ANOVA with Tukey’s multiple comparison tests (n = 6 to 8 mice per group; *P < 0.05, **P < 0.01, and ***P < 0.001). The data are expressed as the means ± SEM.
