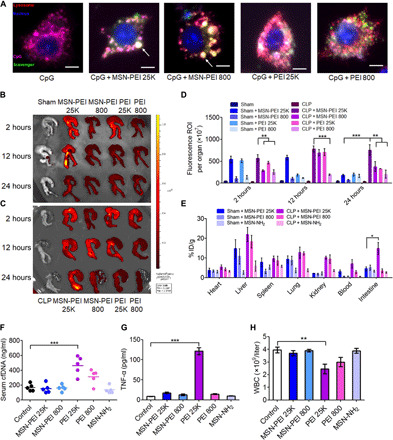
Fig. 6. MSN-PEI 25K shows inflammatory-specific accumulation and retention with negligible toxicity in vivo.

(A) Merged images show intracellular localization of cationic materials and CpG in RAW 264.7 cells after 6 hours of incubation. Scale bars, 5 μm. The large white spots in NABNs-treated cells are marked with an arrow. (B to D) Ex vivo NIRF images of cecum from (B) sham and (C) CLP mice 2, 12, and 24 hours after intraperitoneal injection of Cy7-labeled NABNs or NABPs (20 mg/kg). (D) Semiquantitative analysis of ex vivo fluorescence images of the cecum in (B) and (C). Differences were assessed via one-way ANOVA with Tukey’s multiple comparison tests (n = 3 mice per group; **P < 0.01 and ***P < 0.001). The data are expressed as the means ± SEM. ROI, region of interest. (E) Quantification analysis of Si content in the lung, kidney, heart, liver, spleen, and cecum of sham or CLP mice via inductively coupled plasma optical emission spectrometry (ICP-OES) after intraperitoneal injection of MSN-PEI 25K, MSN-PEI 800, or MSN-NH2 (20 mg/kg) 12 hours before surgery and 1 and 12 hours after surgery. The data are expressed as the means ± SEM (n = 5 mice per group). % ID/g, percentage of the injected dose per gram of tissue. (F to H) Normal mice were intraperitoneally injected three times with MSN-PEI 25K, MSN-PEI 800, PEI 25K, PEI 800, or MSN-NH2 (20 mg/kg) at 0, 13, and 24 hours. (F) cfDNA and (G) TNF-α levels and (H) the white blood cell (WBC) count were measured in the blood 24 hours after the last administration. Differences were assessed via one-way ANOVA with Tukey’s multiple comparison tests (n = 5 to 6 mice per group; *P < 0.05,**P < 0.01, and ***P < 0.001). The data are expressed as the means ± SEM.
