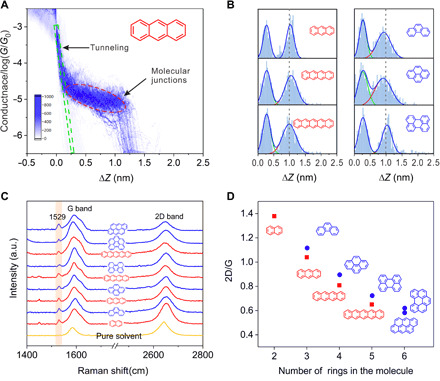
Fig. 2. Displacement and Raman characterization of the graphene M-2D-vdWHs.

(A) The 2D conductance-distance histogram for the graphene M-2D-vdWHs with PAH 3. The green rectangular dashed frame represents tunneling in decane, and the red elliptical dashed frame represents molecular junctions. (B) The relative displacement distributions for the graphene M-2D-vdWHs with PAH 3, PAH 4, PAH 5, PAH 3′, PAH 4′, and PAH 5′. (C) Raman spectrum of the graphene electrode pair that experienced XPBJ operation in the presence of pure solvent (the yellow curve), and the Raman spectra of the graphene M-2D-vdWHs fabricated by the XPBJ method. The sandwiched molecules of the graphene M-2D-vdWHs are PAHs. a.u., arbitrary units. (D) The ratio of the intensities of the G and 2D peaks as a function of the number of benzene rings.
