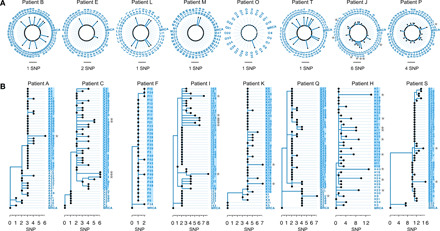
Fig. 2. Phylogenetic trees of Mtb populations from different patients.

All trees are rooted to the inferred ancestral genome and all the “inherited SNPs” were excluded before the phylogenetic reconstruction. The length of solid lines represents the number of de novo SNPs. (A) “Starlike expansion” trees for these patients are shown in a circle format. Trees for patients G and R were not shown because no de novo SNPs were detected. (B) “Stepwise growth” trees for these patients are shown in rectangular format. Gray stars indicate those colonies with excessive de novo SNPs and the taxa names with blue backgrounds highlight the recently expanded populations.
