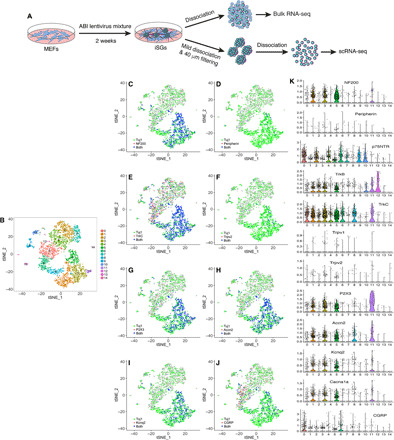
Fig. 5. Single-cell transcriptome profiling of iSG neurons.

(A) Schematic illustration of the processes for bulk RNA-seq and scRNA-seq analyses. (B) t-distributed Stochastic Neighbor Embedding (t-SNE) plot of the 15 cell clusters generated from the sequenced single iSG neurons. (C to J) t-SNE plots colored by expression of the indicated conventional SG marker genes. (K) Violin plots showing expression patterns of the indicated conventional SG marker genes in single-cell clusters.
