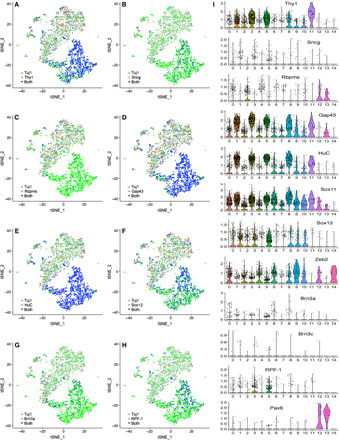
Fig. 6. Expression patterns of conventional RGC marker genes in single iSG neurons.

(A to H) t-SNE plots colored by expression of the indicated conventional RGC marker genes. (I) Violin plots showing expression patterns of the indicated conventional RGC marker genes in single-cell clusters.
