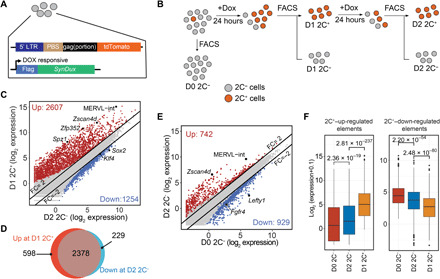
Fig. 1. D2 2C− cells exhibit intermediate transcriptome between 2C-like and pluripotent cells.

(A) Schematic representation of the reporter constructs. Tdtomato is under the MERVL promoter control. synDux refers to codon-optimized exogenous Dux. PBS, primer binding site. LTR, long terminal repeats. (B) Diagrammatic representation of the different cell populations used for RNA sequencing (RNA-seq). (C) Scatterplot comparing the mean expression profiles between D2 2C− and D1 2C+ (2C-like cells) cell population. Criteria: FC > 2 and FDR < 0.001. Genes/repeats up-regulated in 2C-like cells are shown in red, and elements up-regulated in D2 2C− are shown in blue. (D) Venn diagram showing the overlap between the up-regulated genes during ESC–to–2C-like transition (red) and down-regulated genes during the exit from 2C-like state (blue). (E) Scatterplot comparing the mean expression profile between spontaneous D2 2C− and D0 2C− (ESCs). Criteria: FC > 2 and FDR < 0.001. Genes and repeats up-regulated in D2 2C− cells are indicated in red; Genes and repeats up-regulated in D0 2C− are indicated in blue. (F) Box plot showing the log2 expression level of 2C+–up-regulated transcripts and 2C+–down-regulated transcripts in each of the D0 2C−, D2 2C−, and D1 2C+ cell populations. P values were calculated by two-tailed Mann-Whitney U test. All data were derived from two biological RNA-seq repeats.
