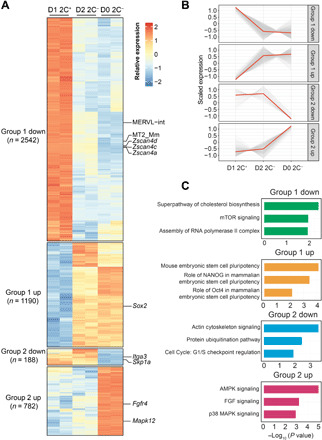
Fig. 2. Transcriptional dynamics during 2C-like state–to–pluripotent state transition.

(A) Heatmap showing the relative expression level of group 1 and group 2 genes from two biologically independent samples of D1 2C+, D2 2C−, and D0 2C− cell population. The number of genes in each category is indicated on the left side of the heatmap. (B) The expression dynamics of the transcripts in group 1 and group 2 genes. Each transcript expression is shown as a gray line; the red line represents the mean expression. (C) Bar plot showing the −log10 (P value) of the pathways enriched in each category of genes (right, right-tailed Fisher’s exact test). All data were derived from two biological RNA-seq repeats.
