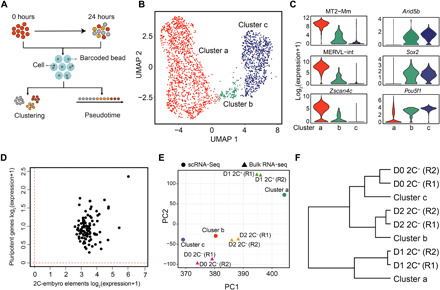
Fig. 3. scRNA-seq reveals an intermediate state during the 2C-like–to–pluripotent state transition.

(A) The workflow of the experimental and data analysis process. A total of 1304 and 994 cells with >800 transcripts were obtained at 0 and 24 hours after the exit from 2C-like state, respectively. (B) Uniform Manifold Approximation and Projection (UMAP) of the sequenced cells. Cluster a (1397 cells), cluster b (101 cells), and cluster c (800 cells) are indicated. (C) Violin plot showing the log2 expression level of representative 2-cell-embryo and pluripotency marker genes in each cluster. (D) Scatterplot showing the log2 mean expression of 2-cell-embryo transcripts (x axis) and pluripotency transcripts (y axis) in cluster 2 cells. The dashed red lines indicate the threshold for expression. (E) Principal components analysis projection of the single-cell clusters and the fluorescence-activated cell sorting (FACS) isolated cell populations based on their transcriptional profiles. R1 and R2 indicate two replicates. (F) Hierarchical clustering (complete linkage) of the relationship between cell clusters derived from scRNA-seq and FACS-isolated bulk RNA-seq cell populations based on their transcriptome profiles. R1 and R2 indicate two replicates.
