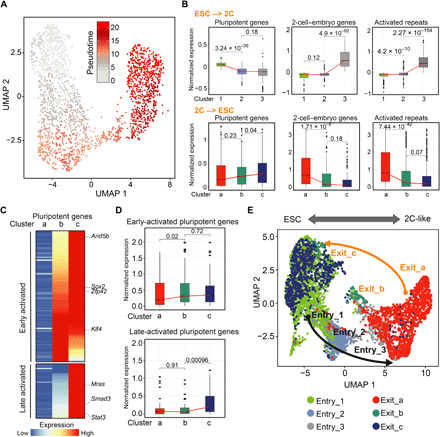
Fig. 4. The intermediate states of forward and reverse transition are distinct.

(A) UMAP plot showing the pseudotime progression. Each cell is colored according to its position in the pseudotime. (B) Box plot showing the expression of 2C+–down-regulated pluripotent genes (n = 135 genes), 2-cell-embryo genes (2C+–up-regulated ZGA genes, n = 349 genes), and 2C+-activated repeats (n = 501 repeats) during the entry (top) and exit from the 2C-like state (bottom). (C) Heatmap showing the expression of 2C+–down-regulated pluripotent genes in each cluster. (D) Box plot showing the expression of early-activated and late-activated pluripotent genes during the exit from the 2C-like state. (E) UMAP projection of cells during entry and exit from the 2C-like state. P values (shown as numbers in the figures) are calculated by two-tailed Mann-Whitney U test.
