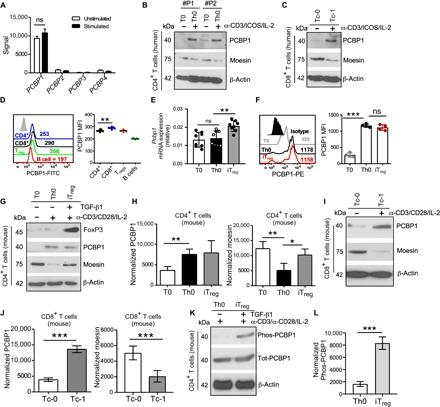
Fig. 1. Activated T cells up-regulate PCBP1.

(A) Expression of mRNA encoding PCBP1-4 in human CD3+ T cells before (Unstimulated) and after (Stimulated) stimulation for 24 hours with anti-CD3 and anti-CD28 (obtained from Gene Expression Omnibus accession code GSE13887). n = 4 biologically independent samples. (B and C) Immunoblotting for total PCBP1 and moesin expression in human CD4+ (B) and CD8+ (C) T cells left unstimulated (T0 and Tc-0) or stimulated (Th0 and Tc-1) with antibodies against CD3 and ICOS with IL-2 for 4 days. β-Actin was used as loading control. (D) Flow cytometry (left) and quantification (right) of PCBP1 expression in subsets of splenic lymphocytes from mice. FITC, fluorescein isothiocyanate. (E and F) Relative Pcbp1 mRNA expression (E) and fluorescence-activated cell sorting (FACS) analysis and PCBP1 mean fluorescence intensity (MFI) in subsets of in vitro polarized T cells. (E) n = 8; (F) n = 4. PE, phycoerythrin. (G and H) Immunoblotting of moesin, PCBP1, FoxP3, and β-actin (G) and quantification for PCBP1 and moesin (H) using splenic mouse CD4+ T cells activated with anti-CD3 and anti-CD28 for 3 days in the absence (Th0) or presence (iTreg) of TGF-β in vitro. n = 5. (I and J) Mouse splenic CD8+ T cells from the same experiments as (G and H). n = 5. (K and L) Immunoblotting for phosphorylated and total PCBP1 (K) in Th0 and iTregs and quantification (L). (D) Error bars represent means ± SE and (E, F, H, J, and L) SD; *P < 0.05, **P < 0.01, and ***P < 0.001 (Student’s t test); ns, not significant.
