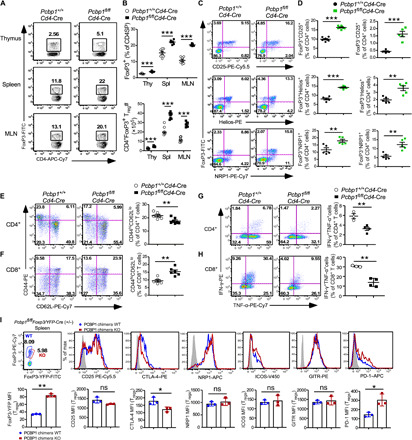
Fig. 2. Loss of PCBP1 causes optimal Treg cell development but is not required for the maintenance of Tregs.

(A and B) Intracellular FoxP3 in CD4+CD8− thymocytes (Thy) and peripheral T cells from the spleen (Spl) and mesenteric lymph nodes (MLN) (A) and quantification (B). n = 7. (C and D) Frequencies of CD25-, Helios-, and NRP1-expressing T cells among CD4+FoxP3+ Tregs (C) and CD4+FoxP3− T cells (D) from the spleen of Pcbp1+/+Cd4-Cre and Pcbp1fl/flCd4-Cre mice. n = 5. (E and F) Representative flow cytometry plots of CD44 and CD62L (left) and quantification (right) in splenic CD4+ (E) and CD8+ (F) T cells from WT and Pcbp1fl/flCd4-Cre mice (n = 6). (G and H) Percentage IFN-γ+TNF-α+–producing T cells (left) and quantification (right) of CD4+ (G) and CD8+ (H) T cells stimulated with phorbol 12-myristate-13-acetate (PMA)/ionomycin in the presence of brefeldin A for 2 hours (WT, n = 3; KO, n = 4). (I) Histograms of CD25, CTLA-4, NRP1, ICOS, GITR, and PD-1 MFI (top) and quantification (bottom) in splenic Tregs from Pcbp1fl/flFoxp3/YFP-Cre+/− chimera female mice. n = 3. (B to I) Error bars represent means ± SE. *P < 0.05, **P < 0.01, and ***P < 0.001 (Student’s t test).
