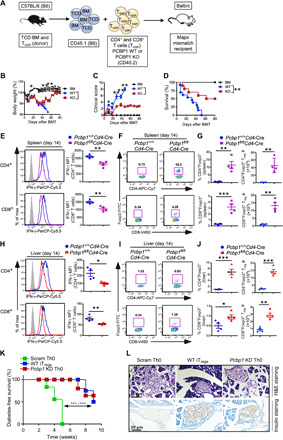
Fig. 3. PCBP1 is essential to drive optimal effector T cell functions but limits Treg cell differentiation.

(A to D) Purified CD25-depleted PCBP1 WT or PCBP1 KO donor T cells (7 × 10⁵; H-2b) were transferred into lethally irradiated (700 centigray) BALB/c (H-2d) mice transplanted with 5 × 10⁶ TCD BM cells per mouse. Schematic for aGVHD using PCBP1 WT and KO T cells (A), average body weight of the GVHD mice (B), clinical scores (C), and survival (D) of recipient mice monitored as indicated. (E) FACS analysis and percentage of IFN-γ MFI in CD4+ and CD8+ T cells from spleen cells stimulated with PMA/ionomycin for 4 hours from GVHD mice on day 14 after allo-BMT. (F and G) Frequency of FoxP3+ Tregs (F) and quantification (G) on day 14 after allo-BMT in the spleen of WT and PCBP1 KO T cell recipients. (H) Expression of IFN-γ (left) and quantified plots (right) in the liver day 14 after allo-BMT. (I and J) FoxP3+ Tregs (I) and quantification (J) in the liver of recipient mice on day 14. (K and L) Diabetes-free survival and histology in diabetes model following transfer of scrambled or Pcbp1 knockdown (KD) or WT iTregs. Diabetes-free survival curve (I), and hematoxylin and eosin (H&E; top)– and insulin (bottom)–stained pancreatic sections from recipient mice (J). (B, C, E, G, H, and J) Error bars represent means ± SE. *P < 0.05, **P < 0.01, and ***P < 0.001 (Student’s t test); (D and K) by log-rank (Mantel-Cox) test.
