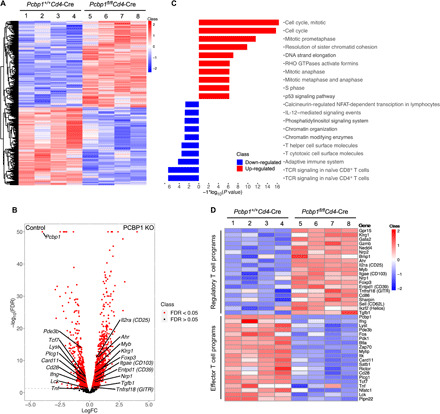
Fig. 4. Effector T cell–intrinsic Treg commitment programs are constrained by PCBP1.

(A) Heat map of DEGs (FDR < 0.1 and absolute log2 fold change > 0.2) in CD4+ cells isolated from the spleen of 6-week-old Pcbp1+/+Cd4-Cre (n = 4) and Pcbp1fl/flCd4-Cre (n = 4) mice. (B) Volcano plot showing differential gene expression in mice. (C) Enrichment of DEGs (FDR < 0.05) in mice for biological process GO terms. GTPases, guanosine triphosphatases. (D) Heat map of up-regulated Treg cell signature and down-regulated effector T cell signature genes (FDR < 0.05) in Pcbp1+/+Cd4-Cre (n = 4) and Pcbp1fl/flCd4-Cre (n = 4) mice.
