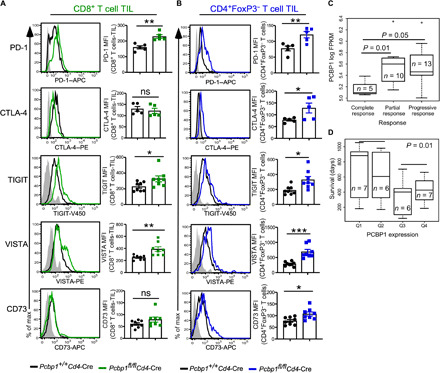
Fig. 7. Deletion of PCBP1 in T cells increases expression of checkpoint molecules and promotes immunosuppression.

(A and B) Flow cytometric analysis (left) and quantification (right) of PD-1, CTLA-4, TIGIT, VISTA, and CD73 expression in tumor CD8+ (A) and CD4+FoxP3− (B) T cells from Pcbp1+/+Cd4-Cre and Pcbp1fl/flCd4-Cre. (C) Analysis of the clinical relevance of PCBP1 mRNA according to response rate (separating complete responders, partial responders, and progressive responders). FPKM, fragments per kilobase of exon model per million reads mapped. (D) Significance of PCBP1 mRNA expression (Q1, lowest; Q4, highest) and relationship to overall survival. (A and B) Error bars represent means ± SE. *P < 0.05, **P < 0.01, and ***P < 0.001 (Student’s t test); (C and D) Mann-Whitney test.
