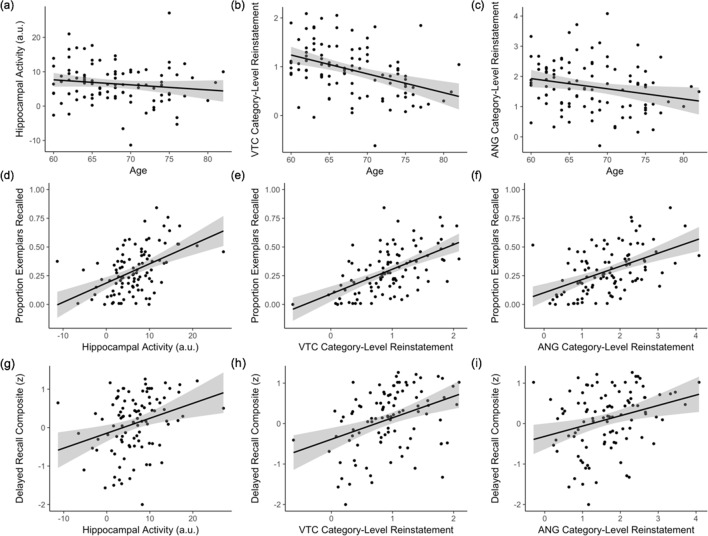
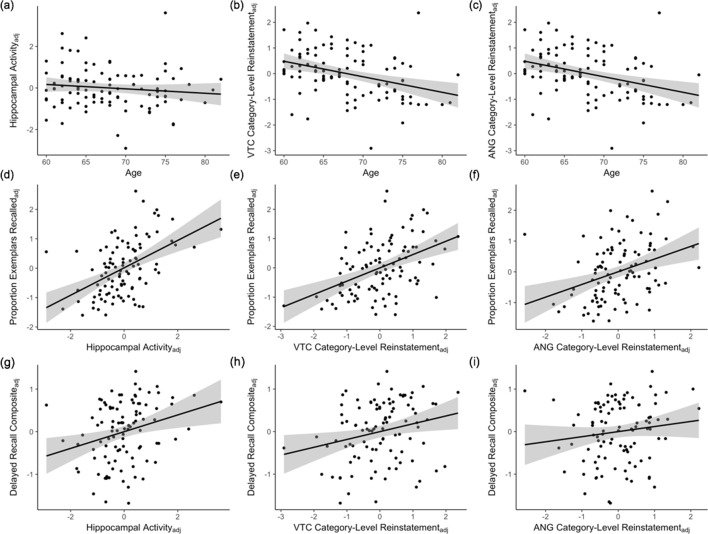
Figure 5. Individual differences in pattern completion assays.
(a–c) Effects of age on hippocampal activity (associative hit – correct rejection) and category-level reinstatement strength (mean logits) in VTC and ANG during associative hits. (d–f) Independent of age, individual differences in hippocampal activity and category-level reinstatement strength in VTC and ANG during associative hits explain significant variance in exemplar-specific recall. (g–i) Independent of age, individual differences in hippocampal activity and VTC category-level reinstatement strength also explain significant variance in standardized delayed recall performance; the relation with ANG category-level reinstatement did not reach significance. Scatterplots reflect raw values for each measure. See Figure 5—figure supplement 1 for partial plots controlling for nuisance variables. Each point represents an individual participant. Plots also show linear model predictions (black line) and 95% confidence intervals (shaded area). VTC = ventral temporal cortex; ANG = angular gyrus.


