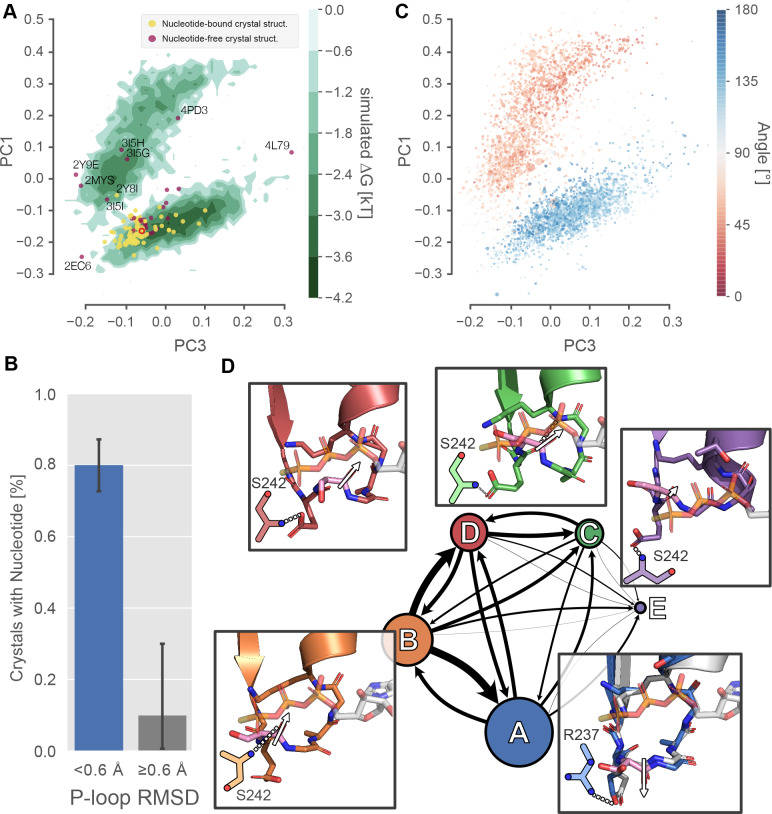
Figure 3. Excited P-loop states are less compatible with nucleotide than the states preferred in crystal structures.
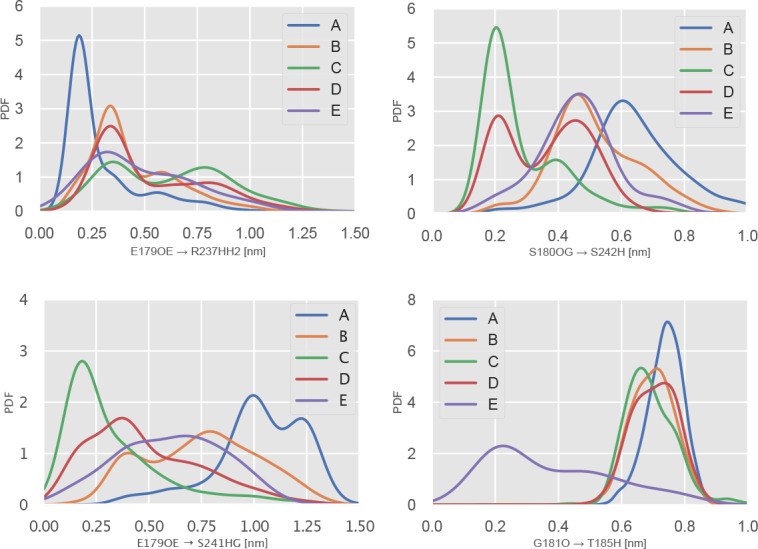
(A) The β-cardiac whole-motor MSM-derived P-loop conformational space projected onto PCs 1 and 3 reveals two distinct free energy basins (green level sets). Yellow and purple points represent crystal structures with and without ligand, respectively. Structures farther than 0.6 Å from the β-cardiac myosin structure (red empty circle) are labeled with their PDB ID. (B) Proximity to the β-cardiac myosin reference conformation is associated with the presence of a nucleotide in crystal structures (p<1.3×10⁻⁵ by Fisher’s exact test), suggesting that the ligand stabilizes the A state. Error bars represent the 95% confidence interval of 1000 bootstrap realizations. (C) The re-orientation of the S180 backbone carbonyl accounts for the split between upper and lower basins. Points represent P-loop conformations from each state in the β-cardiac whole-motor MSM projected onto the same PCs as in panel A. Points are sized by their probability from the MSM and colored by the angle between the backbone carbonyl bond vectors of S180 and K184. (D) Center, each of the five states of the P-loop MSM are indicated as nodes in a network, sized by their equilibrium probability and connected by arrows with line width proportional to the transition probabilities between them. Surrounding the model, insets show example configurations of the P-loop in sticks colored to match the state they represent. State A is associated with a conformation of the S180 (pink sticks) carbonyl bond vector (white arrow) directed away from the nucleotide binding pocket, whereas states B-D are associated with the opposite orientation of the S180 backbone carbonyl bond vector. The A state conformation is the conformation found in most crystal structures. For reference, PDB 1MMA is shown in grey sticks and the crystallographic position of ATP is shown in semi-opaque grey sticks. For all states, important interactions with the Switch-I loop are shown as two-dimensional sketches for visual clarity. An interaction between R237 and E179 is specific to state A, whereas various interactions with S242 are indicative of other states (Figure 3—figure supplement 2).
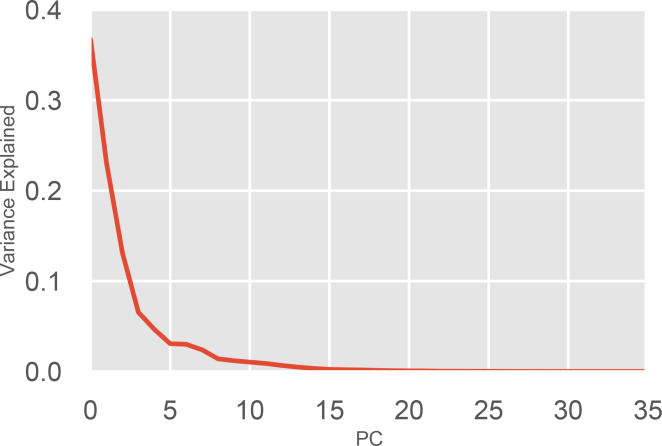
Figure 3—figure supplement 1. Variance explained by each component of the PCA of the of the P-loop on MYH7.
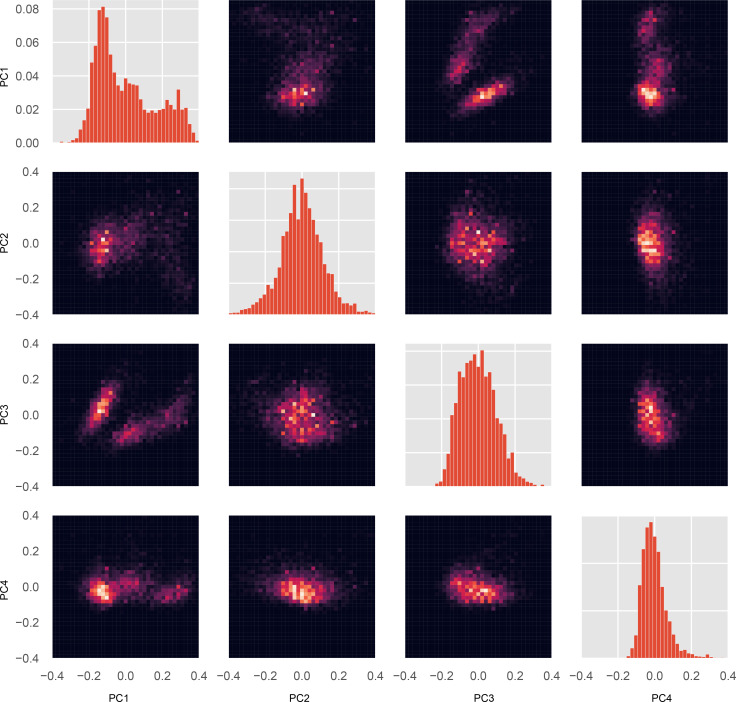
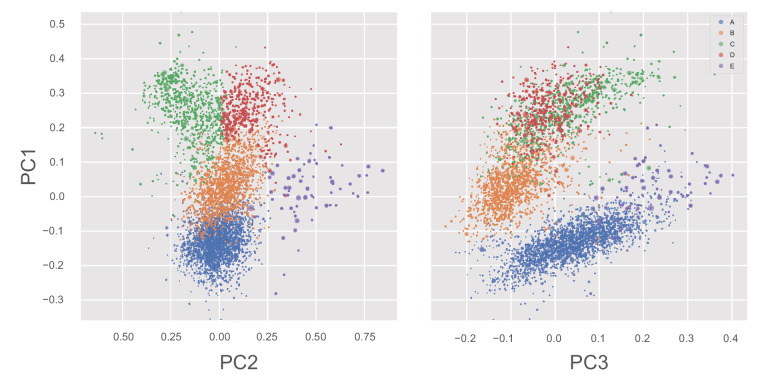
Figure 3—figure supplement 2. Joint and marginal distributions for all pairs of PCs.
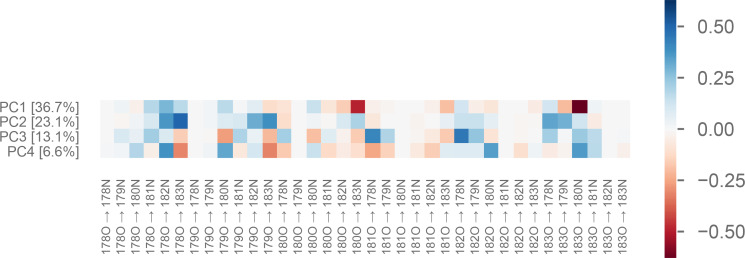
Figure 3—figure supplement 3. Weights of the first four principal components of the P-loop on MYH7.
Figure 3—figure supplement 4. States of the whole-motor MSM of β-lactamase projected into PC1/PC2 and PC1/PC3 planes.
Figure 3—figure supplement 5. Specific interactions with Switch-I residues are statistical hallmarks of P-loop states.
