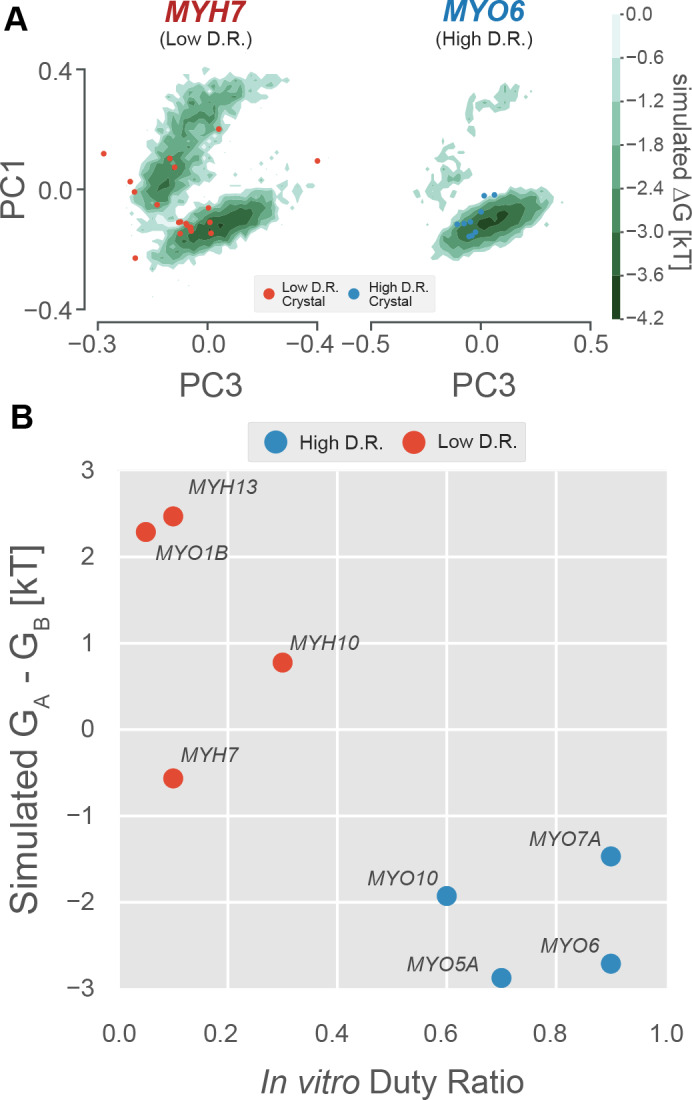
Figure 4. The free energy landscape of the P-loop encodes duty ratio.

(A) Free energy landscapes implied by whole-motor domain MSMs in the PC1/PC3 plane demonstrate that the upper basin is well sampled by an example low duty ratio motor (MYH7, left) and poorly sampled by an example high duty ratio motor (MYO6, right). Ligand-free crystal P-loop conformations from high and low duty ratio motors are shown as blue and red points, respectively. (B) Experimental duty ratio (x-axis) is correlated with the simulated free energy difference between (P-loop MSM-derived) nucleotide favorable and nucleotide-unfavorable states (y-axis, more negative values mean higher probability of the nucleotide-favorable A state). Free energy difference is used rather than probability because the log-scaling improves the legibility of the figure. Error in simulated free energy differences were estimated by jackknife resampling of trajectories and were too small to be visualized as error bars. Aggregate simulation times are listed in Table 3 and were between 126 µs and 323 µs for each point.
