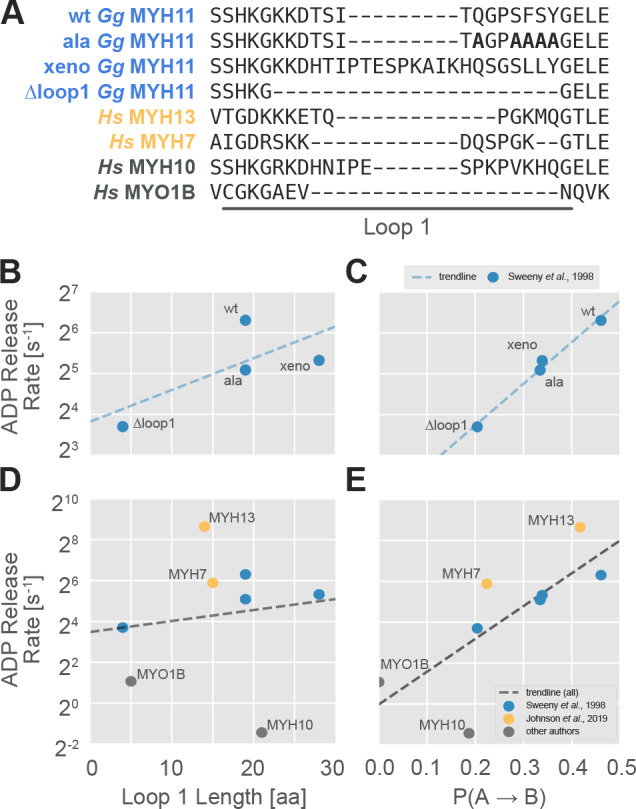
Figure 5. The probability of transitioning from nucleotide-favorable to nucleotide-unfavorable P-loop conformations (P(A→B), derived from P-loop MSMs) predicts experimental ADP release rates for motors with low duty ratios.

(A) Loop 1 sequences and lengths considered in this work. Residues mutated to alanine in the wild-type chicken gizzard MYH11 (wt Gg MYH11) are bolded in the appropriate row. (B) For the Sweeney dataset, there is a moderate relationship between loop 1 length and ADP release rate (Pearson’s R = 0.75) but, (C) there is a much stronger correlation between P(A→B) and ADP release rate (Pearson’s R = 0.99). (D) Across all datasets, the relationship between loop 1 length and ADP release rate is weak (Pearson’s R = 0.14), and (E) there is a much stronger correlation between P(A→B) and ADP release rate (Pearson’s R = 0.75). Error in MSM parameters was estimated by jackknife resampling of trajectories (aggregate simulation times are reported in Table 3, and are on the order of ~100 µs for human motors and ~10 µs for chicken motors) and errors in ADP release rates are those reported in the relevant original publication, where available.
