. 2020 Apr 27;9:e55667. doi: 10.7554/eLife.55667

Figure 1. Diffusive behaviors of protein fusions to HaloTag (Halo) reveal chromatin-bound and free populations in live yeast.

(A, B) Normalized histograms and two-component Gaussian fits for H2A.Z-Halo (A) and Halo-H2B (B) show the log diffusion coefficient distributions. The Gaussian fit for HaloTag is shown for reference (‘Halo only’ in A). (C, D) Normalized histograms and two-component Gaussian fits for Swr1-Halo in WT cells (C) and the swc2Δ mutant (D). Solid line: sum of two-component fit; dashed line: individual component. Percent value of the slow component along with Bootstrap resampling errors and the number of trajectories (n) are indicated. (E) Cumulative distribution functions (CDF) of 10 ms displacements. (F) Spot-On results with fitting errors showing fractions of chromatin-bound molecules derived from modeling CDFs over 10–50 ms intervals. All molecules tracked with JF646 dye except Halo only, which was imaged with JF552.

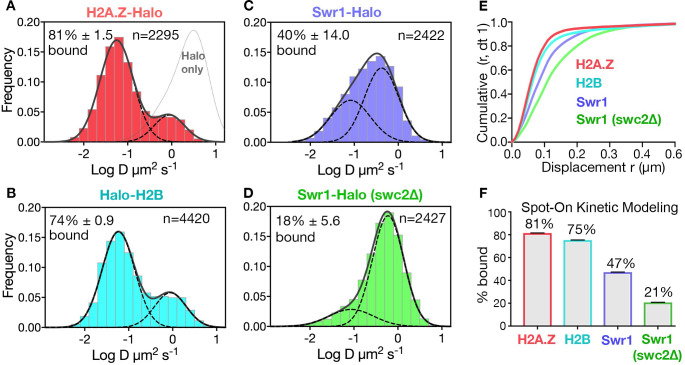
Figure 1.

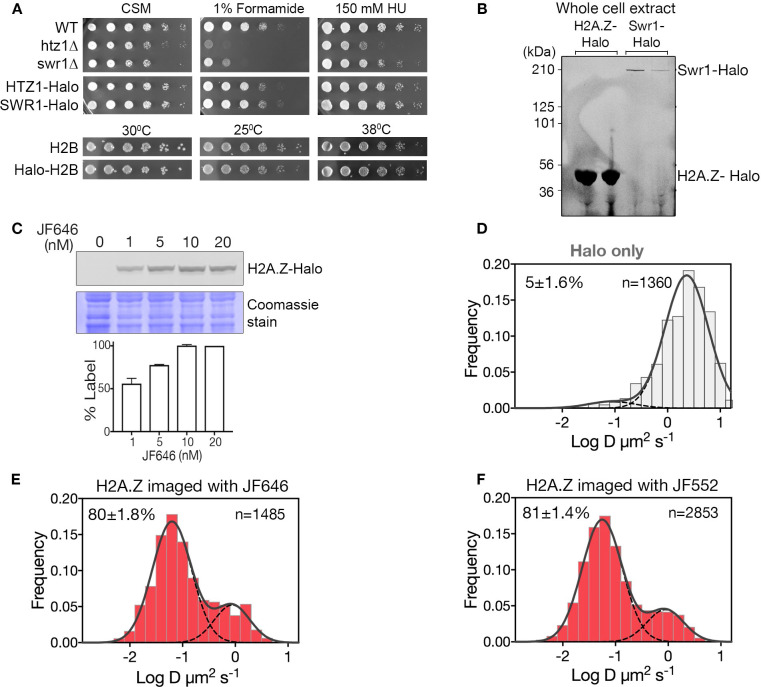
Figure 1—figure supplement 1. Cell growth, labeling and SPT analysis of Halo-tagged proteins.

Figure 1—figure supplement 1.

(A) Growth of strains bearing SWR1, H2A.Z (HTZ1) and H2B (HTB1) fusions to HaloTag. Saturated cultures at optical density 1.0 were spotted (1:5 serial dilutions) on CSM plates with or without 1% formamide or 150 mM HU (hydroxyurea) and incubated for 2–3 days at the indicated temperatures. WT and mutant strains htz1Δ and swr1Δ are shown for comparison. (B) Cells expressing H2A.Z-Halo and Swr1-Halo were stained with JF646 and the cell lysate was resolved on SDS-PAGE. Fluorescent scan of duplicate lanes show specific labeling of Halo-tagged H2A.Z and Swr1 proteins. (C) SDS-PAGE shows 10 nM JF646 saturates H2A.Z-Halo in yeast cells in a routine 2 hr staining period. (D) Normalized histogram and two-component Gaussian fit for HaloTag (fused to NLS). The slow fraction is 5%. (E) Top: Profile of H2A.Z-Halo diffusivity in biological replicate, same condition as Figure 1A experiment. (F) Profile of H2A.Z-Halo diffusivity in cells stained with JF552. All molecules tracked with JF552 dye except (E), which was tracked with JF552.
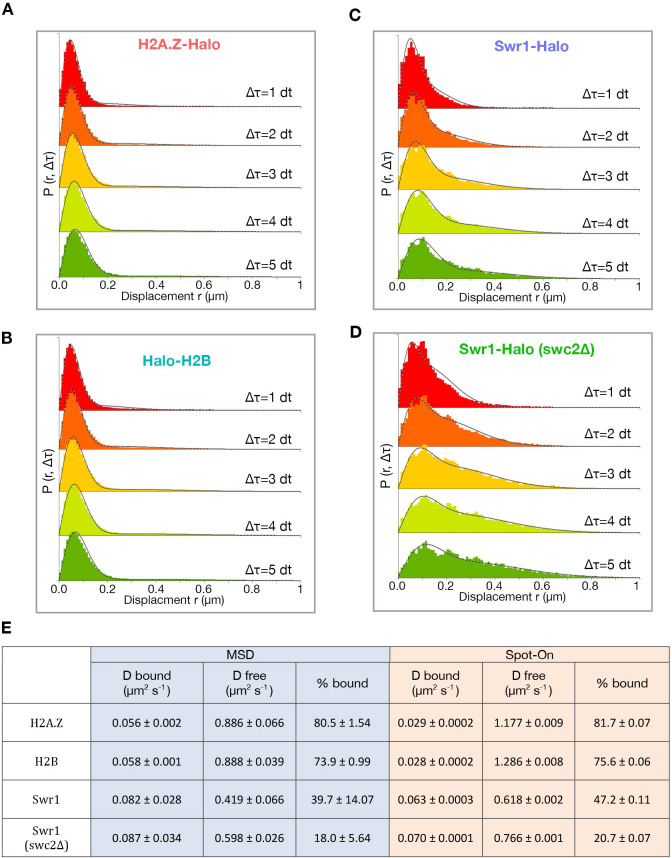
Figure 1—figure supplement 2. Spot-On kinetic modeling analysis.

Figure 1—figure supplement 2.

(A) Histogram of displacements over time intervals of 10, 20, 30, 40 and 50 ms (dt 1–5) for H2A.Z. First four displacements were included for each track. Kinetic fitting shown as dashed line and measured displacements in color. Data were analyzed using the Spot-On web-interface (https://SpotOn.berkeley.edu). (B) Spot-On analysis of H2B. (C,D) Spot-On analysis of Swr1 in WT and swc2Δ cells. (E) Comparison of diffusive parameters for H2A.Z, H2B, Swr1 and Swr1 in the swc2Δ strain, extracted from MSD-based and Spot-On analytic platforms. Bootstrap resampling errors shown for MSD and fitting errors shown for Spot-On. All molecules tracked with JF646 dye.
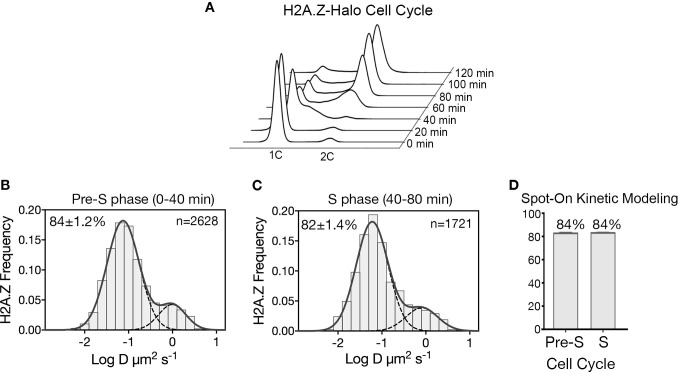
Figure 1—figure supplement 3. H2A.Z-Halo distribution in cell division cycle.

Figure 1—figure supplement 3.

(A) FACS analysis shows DNA content of the synchronized cell population upon time of release from α-factor arrest, from 0’ – 120.’ (B, C) Normalized histogram and two-component Gaussian fit for H2A.Z-Halo in cells synchronized in pre-S phase, and in S phase. (D) Spot-On results shows both Pre-S and S phase cells have 84% chromatin bound H2A.Z. All molecules tracked with JF646 dye.