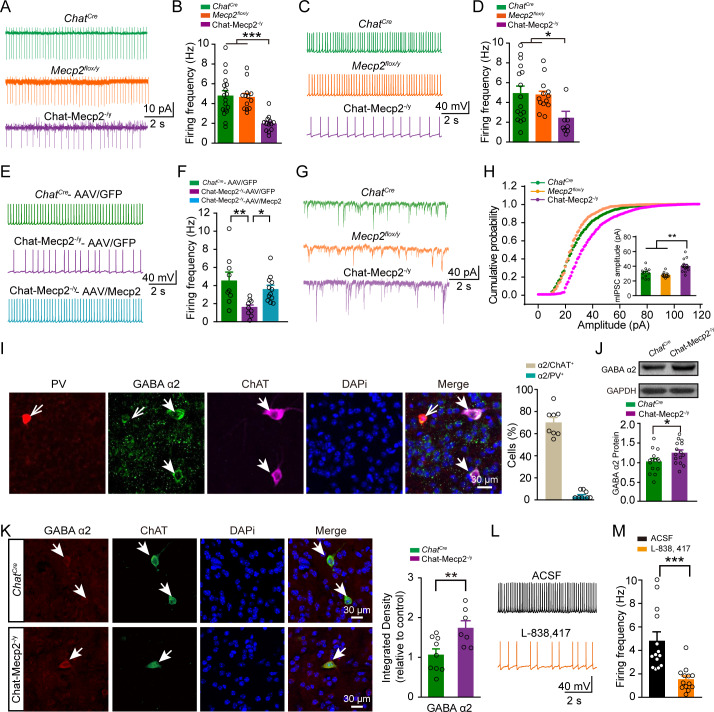
Figure 3. Spontaneous Firing of Cholinergic Interneurons Decreased via Elevated Expression of GABAA α2 Receptors in Chat-Mecp2-/y Mice.
(A, B) Example traces of spontaneous spiking (A) or averaged frequency (B) measured in a cell-attached configuration from NAc cholinergic interneurons. P-values were calculated by one-way analysis of variance (ANOVA) with Bonferroni’s multiple comparisons test. F (2, 41)=13.93, p<0.0001. n = 18 neurons from three mice (ChatCre), 13 neurons from three mice (Mecp2flox/y), 13 neurons from five mice (Chat-Mecp2-/y). (C, D) Example traces of spontaneous spiking (C) or averaged frequency (D) measured in a whole-cell configuration from NAc cholinergic interneurons. P-values were calculated by one-way ANOVA with Bonferroni’s multiple comparisons test. F (2, 34)=5.336, p=0.0096. n = 16 neurons from three mice (ChatCre), 13 neurons from four mice (Mecp2flox/y), 8 neurons from five mice (Chat-Mecp2-/y). (E, F) Example traces of spontaneous spiking (E) or averaged frequency (F) measured in a whole-cell configuration from NAc neurons infected by AAV-GFP or AAV/Mecp2 for indicated genotype. Data are means ± SEM. P-values were calculated by one-way ANOVA with Tukey’s multiple comparisons test. F (2, 27)=6.201, p=0.0061. n = 9 neurons from three mice (ChatCre-AAV/GFP), 9 neurons from three mice (Chat-Mecp2-/y-AAV/GFP), 12 neurons from three mice (Chat-Mecp2-/y-AAV/Mecp2). (G, H) Example mIPSC traces (G) measured in whole-cell configuration from NAc cholinergic interneurons. (H) Cumulative distribution of mIPSC amplitude of NAc cholinergic interneurons. P-values were calculated by one-way ANOVA with Bonferroni's multiple comparisons test. F (2, 39)=15.46, p<0.0001. n = 12 neurons from four mice (ChatCre), 14 neurons from four mice (Mecp2flox/y), 16 neurons from four mice (Chat-Mecp2-/y). (I) Confocal images showing NAc sections stained for PV, ChAT, GABAA α2 receptor, and DAPI. Bar graph showing percentage of ChAT or PV-positive cells co-expressing GABAA α2 receptor in wild-type (WT) mice. n = 8 sections from two mice. (J) Immunoblotting of GABAA α2 receptor in NAc extracts prepared from ChatCre and Chat-Mecp2-/y mice. Each lane was loaded with 40 μg of protein, with GAPDH as loading control, and normalized to ChatCre levels. P-values were calculated by two-tailed unpaired t-test. t = 2.153, df = 28, p=0.0401. n = 15 mice per group. (K) Representative images of NAc slices from ChatCre and ChAT-Mecp2-/y mice. Statistically integrated immunofluorescence data normalized to ChatCre levels. P-values were calculated by two-tailed unpaired t-test. t = 2.986, df = 14, p=0.0098. n = 7–9 sections from two mice per group. (L, M) Example traces (L) and statistical results (M) of spontaneous spiking recorded from cholinergic interneurons in NAc of different groups. P-values were calculated by two-tailed unpaired t-test. t = 3.977, df = 25, p=0.0005. n = 14 neurons from four mice for ACSF, n = 13 neurons from four mice for L-838,417. L-838,417: an α2-subunit-selecive selective positive allosteric modulator of GABAA receptors. Data are means ± SEM. *p<0.05, **p<0.01, ***p<0.001, NS means no significance.


