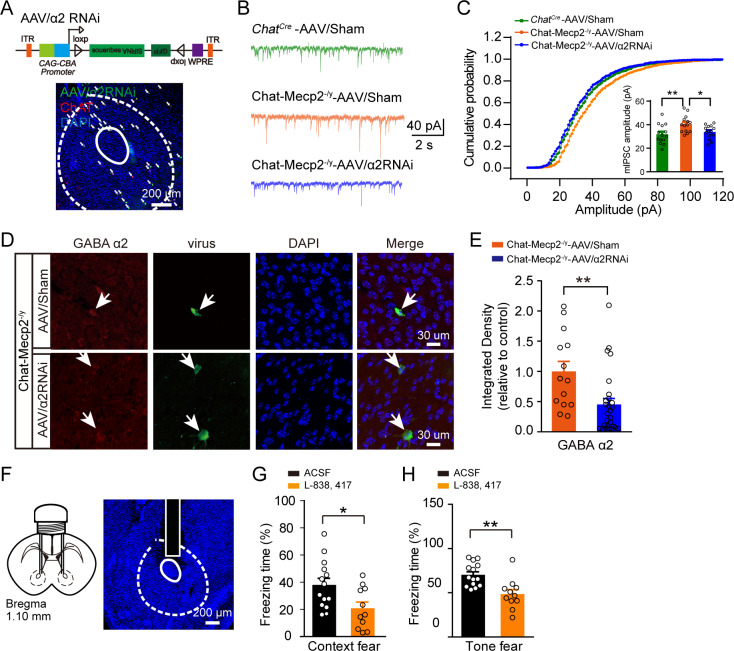
Figure 6. Manipulation of α2-GABAA Receptors in NAc Mimicked Fear Deficits in Chat-Mecp2-/y Mice.
(A) Schematic of AAV/RNAi viral construct. Confocal image of injected NAc slice demonstrating colocalization of GFP expression with ChAT antibody, co-stained with DAPI. (B, C) mIPSCs of AAV/RNAi-infected NAc neurons from Chat-Mecp2-/y mice were rescued. (B) Examples of mIPSC traces. (C) Cumulative distribution of mIPSC amplitude of NAc neurons infected by AAV-Sham or AAV/RNAi. P-values were calculated by one-way analysis of variance (ANOVA) with Bonferroni’s multiple comparisons test. F (2, 39)=5.816, p=0.0062. n = 14 neurons from four mice for each group. (D) Representative images of NAc slices from Chat-Mecp2-/y mice injected with AAV/GFP or AAV/RNAi. (E) Statistically integrated immunofluorescence data of α2-GABAA receptors normalized to AAV/GFP levels. P-values were calculated by two-tailed unpaired t-test. t = 2.985, df = 39, p=0.0049. n = 27 neurons from three mice (AAV/RNAi), 14 neurons from three mice (AAV/Sham). (F) Left: Schematic of cannula implantation. Right: Infusion sites of drugs, stained with DAPI. (G, H) Fear deficit was measured by retrieval process in fear conditioning test 20 min after drug application. P-values were calculated by two-tailed unpaired t-test. t = 2.542, df = 23, p=0.0182 for (E). t = 3.609, df = 23, p=0.0015 for (F). n = 14 mice for ACSF, n = 11 mice for L-838,417. Data are means ± SEM. *p<0.05, **p<0.01.
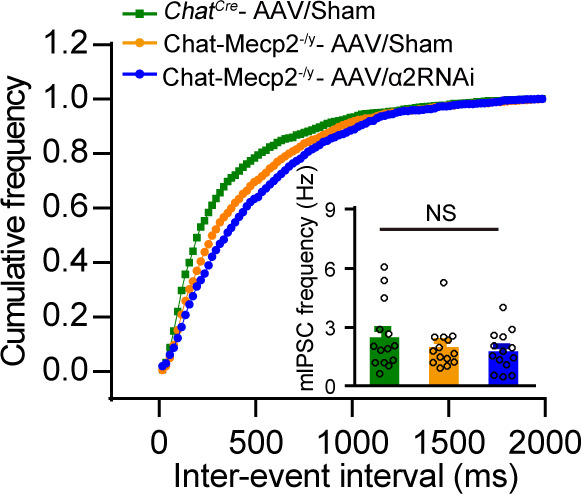
Figure 6—figure supplement 1. Knockdown of α2-GABAA Receptors in Cholinergic Interneurons Did Not Affect mIPSC Frequency in Cholinergic Interneurons, Related to Figure 6.


