. 2020 May 21;9:e50138. doi: 10.7554/eLife.50138

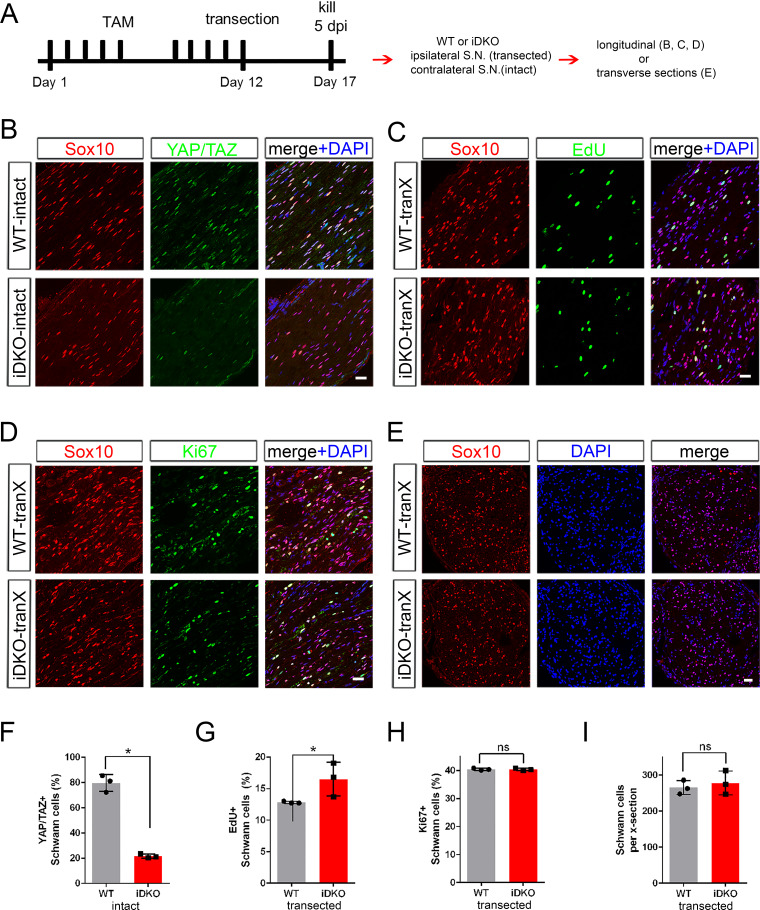
Figure 3. YAP/TAZ are dispensable for Schwann cell proliferation after axotomy.

(A) Schematic showing timeline of tamoxifen injection, sciatic nerve transection and sacrifice of adult WT or Yap/Taz iDKO. (B) Longitudinal sections of intact sciatic nerves showing efficient deletion of YAP/TAZ in iDKO. SC nuclei are marked by Sox10 (red). All cell nuclei are marked by DAPI (blue). (C) Longitudinal sections of transected nerves of WT or iDKO showing SCs in S-phase of the cell cycle marked by EdU (green). (D) Longitudinal sections of transected nerves of WT or iDKO showing proliferating SCs marked by Ki67 (green). (E) Transverse sections of transected nerves of WT or iDKO showing SCs marked by Sox10 (red). (F) Quantification of SCs expressing nuclear YAP/TAZ in intact sciatic nerves of WT or iDKO. n = 3 mice per genotype, *p=0.0495, Mann-Whitney. (G) Quantification of EdU+ SCs in transected nerves of WT or iDKO. n = 3 mice per genotype, *p=0.0463, Mann-Whitney. (H) Quantification of Ki67+ proliferating SCs in transected nerves of WT or iDKO. n = 3 mice per genotype, ns, not significant, p=0.5127, Mann-Whitney. (I) Quantification of Sox10+ SCs in transected nerves of WT or iDKO. n = 3 mice per genotype. ns, not significant, p=0.8273, Mann-Whitney. Scale bars = 30 μm (B–E).

Figure 3—source data 1. Source files for EdU+ SC data.
This zip archive contains the IHC images for one WT and one iDKO used for the quantitative analysis shown in Figure 3G. Leica SP8 confocal lif images were processed using Imaris software and saved as tiffs.
Figure 3—source data 2. Source files for Ki67+ SC data.
This zip archive contains the IHC for one WT and one iDKO used for quantitative analysis shown in Figure 3H. Results and quantitation shown in the Figure used BD #550609 anti-Ki67. These results were confirmed using a second antibody, Abcam #ab15580 anti-Ki67. Images using both antibodies are included in the zip archive, in the indicated folders. Leica SP8 confocal lif images were processed using Imaris software and saved as tiffs.
Figure 3—source data 3. Source files for graphs quantifying Yap/Taz+ SCs, EdU+ SCs, Ki67+ SCs, and total SCs.
This zip archive contains the raw data for WT and iDKO used for the quantitative analysis shown in Figure 3F, G, H and I. The data are contained in both a text document and an Excel file, both labeled as Mann Whitney data. These files also contain data for Figure 3—figure supplement 1, Figures 4, 5, 6, 7, 8A and Figure 8—figure supplement 1E.

Figure 3.

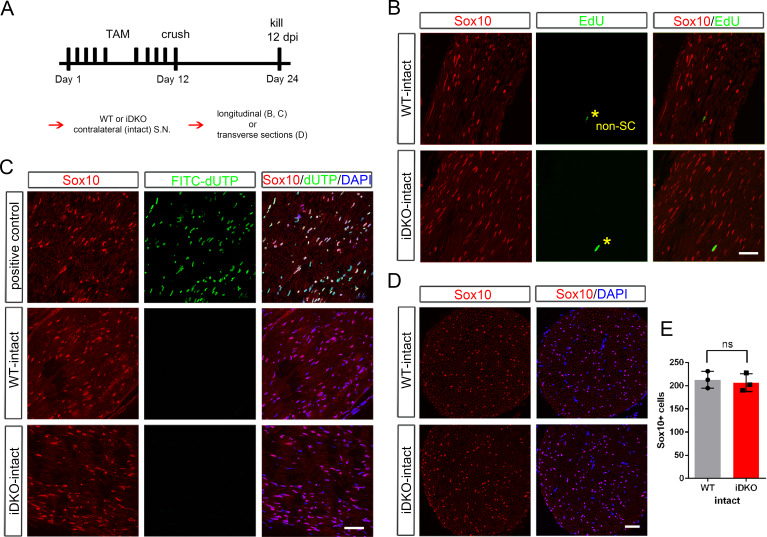
Figure 3—figure supplement 1. No Schwann cell proliferation or death in intact nerves of Yap/Taz iDKO at 12 dpi.

Figure 3—figure supplement 1.

(A) Schematic showing experimental procedures analyzing contralateral intact nerves of WT or iDKO at 12 dpi. (B) Longitudinal sections showing absence of EdU+ SCs in S-phase in intact nerves of iDKO, as in WT. Asterisks denote EdU+ cells that are not SCs, as indicated by their lack of Sox10. (C) Longitudinal sections of contralateral intact nerves, showing absence of apoptotic SCs identified by FITC-dUTP incorporation in iDKO, as in WT. (D) Transverse sections of intact nerves, showing similar numbers of SCs (marked by Sox10) in intact nerves of WT and iDKO at 12 dpi. All nuclei are marked by DAPI. (E) Quantification of SCs in intact nerves of WT or iDKO, showing no significant difference. n = 3 mice per genotype. ns, not significant, p=0.5127, Mann-Whitney. Scale bars = 50 μm (B–D).
Figure 3—figure supplement 1—source data 1. Source files for graph quantifying total SCs.
This zip archive contains the raw data for WT and iDKO used for the quantitative analysis shown in Figure 3—figure supplement 1E. The data are contained in both a text document and an Excel file, both labeled as Mann Whitney data. These files also contain data for Figure 3—figure supplement 1, Figures 4, 5, 6, 7, 8 and Figure 8—figure supplement 1E.