. 2020 May 21;9:e50138. doi: 10.7554/eLife.50138

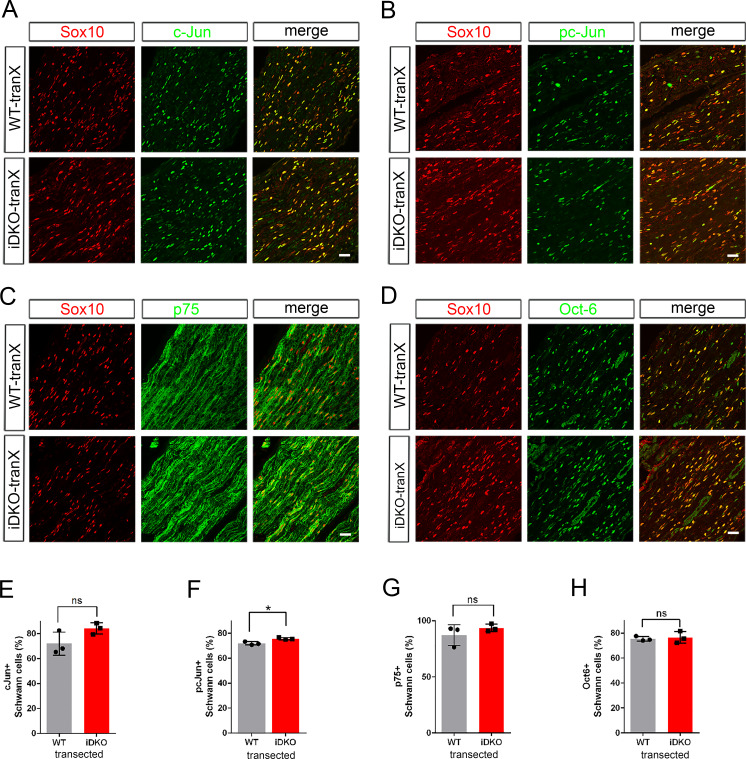
Figure 4. Schwann cells lacking YAP/TAZ transdifferentiate into repair Schwann cells.

Longitudinal sections of transected sciatic nerves of WT and Yap/Taz iDKO immunostained by various markers of growth-promoting repair SCs at five dpi. SCs are marked by Sox10 (red). (A) Representative sections showing upregulation of c-Jun in iDKO SCs, as in WT SCs. (B) Upregulation of active phospho-S63 c-Jun in iDKO SCs, as in WT. (C) Upregulation of p75 in iDKO SCs, as in WT SCs. (D) Upregulation of Oct-6 in iDKO SCs, as in WT SCs. (E) Quantification of c-Jun+ SCs in WT and iDKO. n = 3 mice per genotype. ns, not significant, p=0.1266, Mann-Whitney. (F) Quantification of pc-Jun+ SCs in WT and iDKO. n = 3 mice per genotype. *p=0.0495, Mann-Whitney. (G) Quantification of p75+ SCs in WT and iDKO. n = 3 mice per genotype. ns, not significant, p=0.5127, Mann-Whitney. (H) Quantification of Oct-6+ SCs in WT and iDKO. n = 3 mice per genotype. ns, not significant, p=0.8273, Mann-Whitney. Scale bars = 30 μm (A–D).

Figure 4—source data 1. Source files for c-Jun+ SC data.
This zip archive contains the IHC for one WT and one iDKO used for quantitative analysis shown in Figure 4E. Leica SP8 confocal lif images were processed using Imaris software and saved as tiffs.
Figure 4—source data 2. Source files for graphs quantifying c-Jun+ SCs, pc-Jun+ SCs, p75+ SCs, and Oct6+ SCs.
This zip archive contains the raw data for WT and iDKO used for the quantitative analysis shown in Figure 4E, F, G and H. The data are contained in both a text document and an Excel file, both labeled as Mann Whitney data. These files also contain data for Figure 3—figure supplement 1, Figures 5, 6, 7, 8 and Figure 8—figure supplement 1E.
Figure 4—source data 3. Western blotting analysis of repair Schwann cell markers.
Uncropped Western blots of images used to make Figure 4—figure supplement 1. Individually processed samples from 2 WT (#656, #625) and 2 iDKO mice (#378, #379) are shown and used for quantification. The following figure supplements are available for Figure 4.

Figure 4.

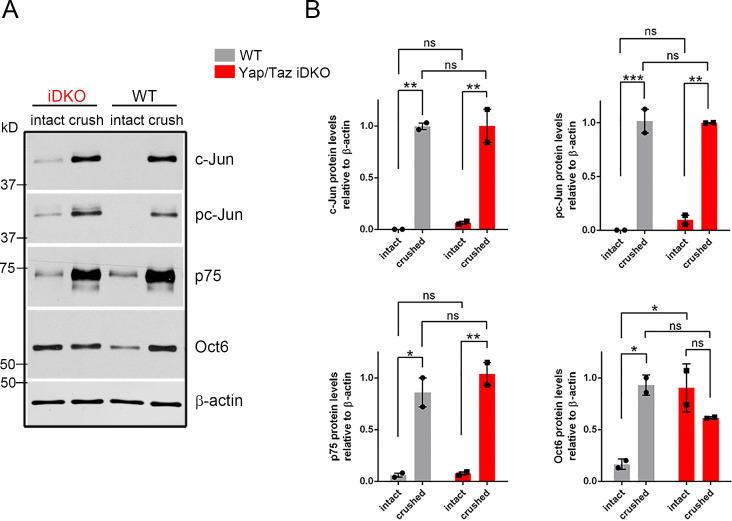
Figure 4—figure supplement 1. Western blotting analysis of repair Schwann cell markers.

Figure 4—figure supplement 1.

(A) Western blots of lysates prepared from contralateral (intact) or distal crushed sciatic nerves of WT and iDKO adult mice five dpi. c-Jun, active pS63-c-Jun and p75 are strongly upregulated in iDKO, as in WT. Oct6 is strongly upregulated in WT and remains elevated before and after crush in iDKO. (B) Quantification of Western blots. ns = not significant, 2-way ANOVA. c-Jun: WT intact vs WT crushed, **p=0.0035; WT intact vs iDKO intact, p=0.9388; WT crushed vs iDKO, p>0.9999; iDKO intact vs iDKO crushed, **p=0.0045. pc-Jun: WT intact vs WT crushed, ***p=0.0009; WT intact vs iDKO intact, p=0.6737; WT crushed vs iDKO crushed, p=0.9962; iDKO intact vs iDKO crushed, **p=0.0015. p75: WT intact vs WT crushed, *p=0.0112; WT intact vs iDKO intact, p=0.9993; WT crushed vs iDKO crushed, p=0.5521; iDKO intact vs iDKO crushed, **p=0.0056. Oct6: WT intact vs WT crushed, *p=0.0139; WT intact vs iDKO intact, *p=0.0157; WT crushed vs iDKO crushed, p=0.2109; iDKO intact vs iDKO crushed, p=0.2541.
Figure 4—figure supplement 1—source data 1. Source files for graphs quantifying c-Jun, pc-Jun, p75 and Oct6 Westerns.
This zip archive contains the raw data for WT and iDKO used for the quantitative analysis shown in Figure 4—figure supplement 1. Data are in GraphPad Prism files, as indicated.