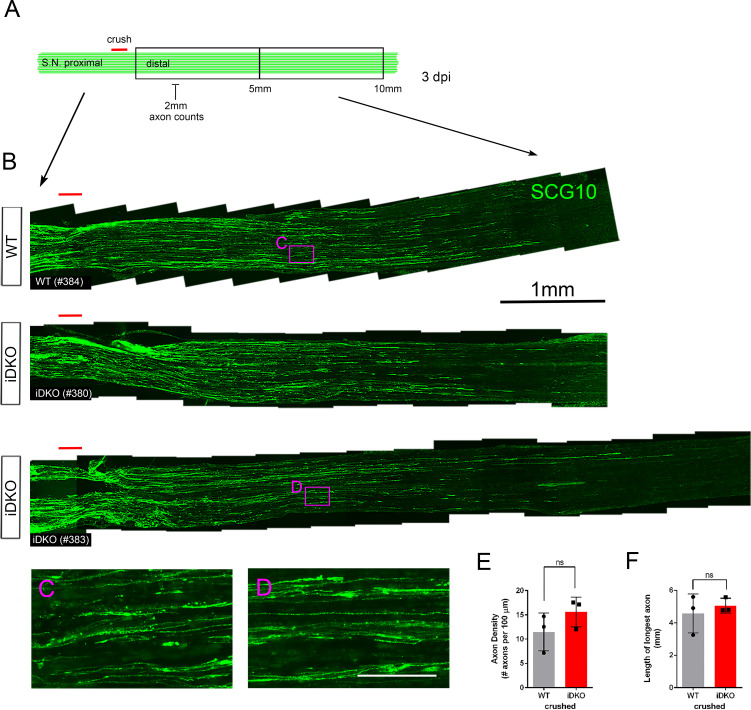
Figure 6. Schwann cells lacking YAP/TAZ support timely axon regeneration after acute injury.
(A) Schematic showing relative locations of crushed site, axon quantification and sizes of the distal nerve segments used for light microscopic analysis of axon regeneration in WT or Yap/Taz iDKO, 3 days after nerve crush. (B) Low magnification views of longitudinal sections, showing abundant axon regeneration in both WT and iDKO. Regenerating axons are marked by SCG10. (C, D) High magnification views of boxed areas in (B), showing numerous thin regenerating axons. (E) Quantification of the axon density measured at 2 mm distal to the crushed site. n = 3 mice per genotype. ns, not significant, p=0.2752, Mann-Whitney. (F) Quantification of the distance regenerated by the longest axon. n = 3 mice per genotype. ns, not significant, p=0.8273, Mann-Whitney. Scale bars = 1 mm (B), 100 μm (C, D).

