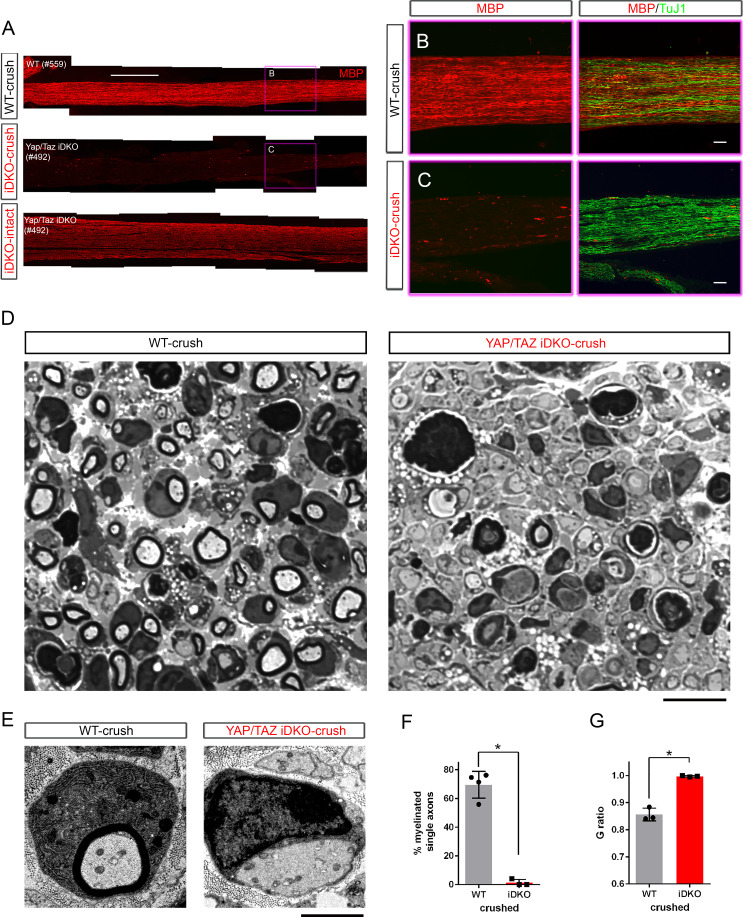
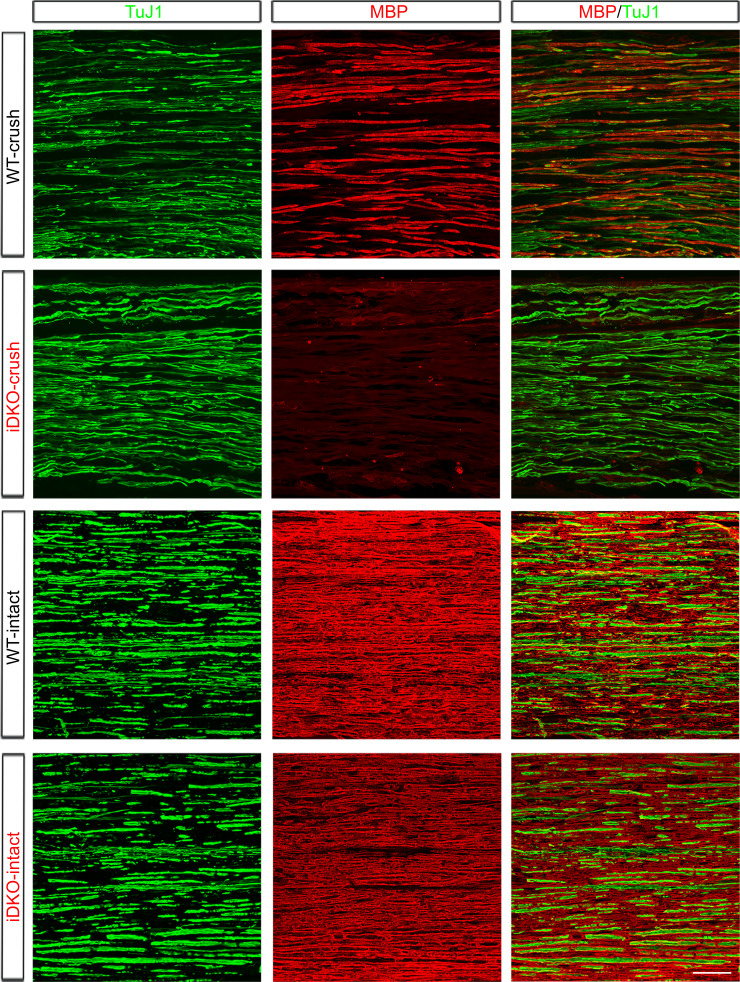
Figure 7. Schwann cells lacking YAP/TAZ fail to myelinate regenerated axons.
Ultrastructural and light microscopic analyses of remyelination in distal nerves of WT or Yap/Taz iDKO, 12–13 days after nerve crush. (A) Low magnification views of longitudinal sections of intact or crushed nerves of WT and iDKO, showing no myelination of regenerated axons in crushed nerves of iDKO as indicated by the lack of MBP immunostaining. Refer to Figure 5B for robustly regenerated axons in the same iDKO mouse. (B, C) High magnification views of boxed area in (A), showing abundant regenerated axons in crushed nerves of both WT (B) and iDKO (C). Note that regenerated axons in iDKO are not myelinated. Axons and myelin are marked by TuJ1 and MBP, respectively. (D) Semi-thin sections stained with toluidine blue showing numerous myelinated axons in crushed nerves of WT but not in iDKO. (E) TEM images of representative single large axons, myelinated in WT (left panel) but unmyelinated in iDKO (right panel). (F) Quantification of the percentage of single axons that are myelinated. n = 4 mice for WT and three mice for iDKO. *p=0.0323, Mann-Whitney. (G) G-ratio in WT and iDKO. Myelinated axons in WT are compared to unmyelinated single axons in iDKO. n = 3 mice per genotype. *p=0.0495 Mann-Whitney. Scale bars = 500 μm (A), 100 μm (B, C), 10 μm (D), 2 μm (E).


