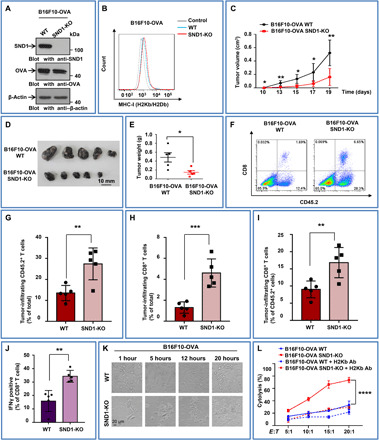
Fig. 6. SND1 deletion promotes specific antigen presentation and enhances antitumor immunity.

(A) B16F10 cells with stable depletion of SND1 by CRISPR-Cas9 system were stably transfected with OVA vector, followed by IB. (B) B16F10-OVA with SND1 deficiency was analyzed by flow cytometry for murine MHC-I (H2Kb/H2Db). (C to E) OT-I mice were injected with equal numbers of WT or SND1-KO B16F10-OVA cells, and tumor growth was observed over time. Then tumors were removed, photographed, and weighted. *P < 0.05 and **P < 0.01. (F) Flow cytometry was used for the analysis of CD45.2+ leucocyte and CD8+ T cell infiltration in tumor tissues. (G to I) Percentages of infiltrating CD45.2+ leucocytes and CD8+ T cells among total tumor tissue–derived cells and the percentage of infiltrating CD8+ T cells among total CD45.2+ leucocytes. n = 5 tumors for each group. **P < 0.01 and ***P < 0.001, by unpaired t test. (J) CD8+ T cells were purified from spleens of tumor-bearing OT-I mice and stimulated with 257 to 264 (SIINFEKL) peptide of OVA for 24 hours. Percentages of IFNγ+CD8+ T cells among total CD8+ T cells in the culture system were measured by flow cytometry. (n = 5, **P < 0.01). The experiments were repeated two times independently. (K) CD8+ T cells recognizing specific peptide of OVA (SIINFEKL) were purified from spleens of OT-I and then cocultured with WT or SND1-KO B16F10 cells stably expressing OVA (CD8+ T:B16F10-OVA, 10:1). Representative images were taken under a bright field at different time points. Scale bar, 20 μm. (L) In vitro comparison of cytolysis rates against CD8+ T cells purified from spleens of OT-I mice between WT and SND1-KO B16F10-OVA cells at different cell rates of CD8+ T (effector cells) to B16F10 (target cells) with/without anti–MHC class I antibodies (Ab) (E:T, 5:1, 10:1, 15:1, or 20:1). A lactate dehydrogenase–releasing cytotoxicity assay was performed to measure the cytolysis efficiency of CD8+ T cells on tumor cells. Each bar represents mean ± SD for biological triplicate experiments. ****P < 0.0001, two-way analysis of variance (ANOVA).
