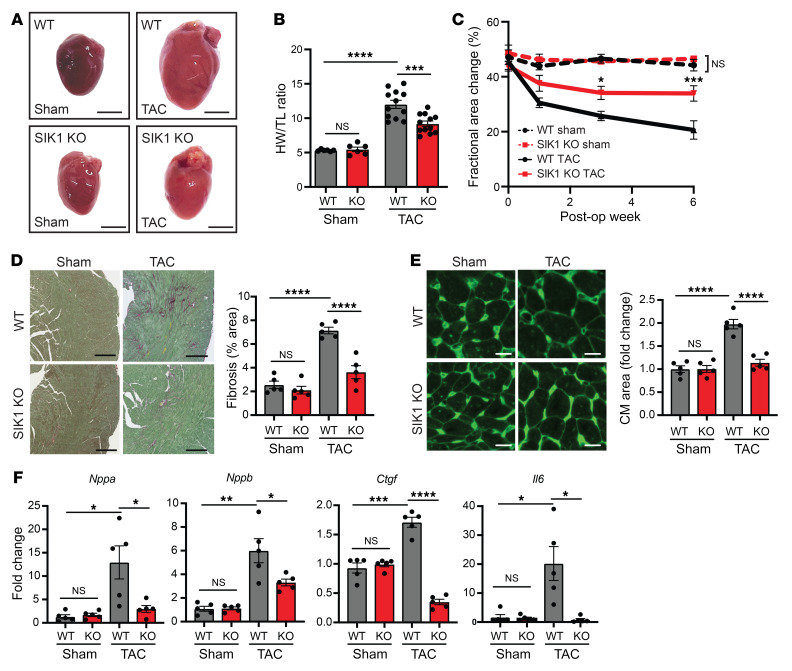
Figure 3. Global loss of SIK1 protects against pathologic cardiac remodeling in vivo.
(A) Representative photos of freshly excised hearts. Scale bars: 3 mm. (B) Heart weight/tibial length (HW/TL) ratio (n = 6 for sham, n = 12 for TAC). (C) Echocardiographic measurements of fractional area change (n = 6 for sham, n = 12 for TAC). *P < 0.05, ***P < 0.001 for SIK1-KO TAC vs. WT TAC by 2-way ANOVA with Tukey’s multiple-comparisons test. (D) Picrosirius red staining of heart sections (n = 5). Scale bars: 300 μm. (E) Wheat germ agglutinin staining of heart sections (n = 5). Scale bars: 20 μm. (F) qRT-PCR expression for canonical heart failure–associated genes (n = 5). Data are shown as means + SEM unless noted. *P < 0.05, **P < 0.01, ***P < 0.001, ****P < 0.0001, by 1-way ANOVA with Tukey’s multiple comparisons test.

