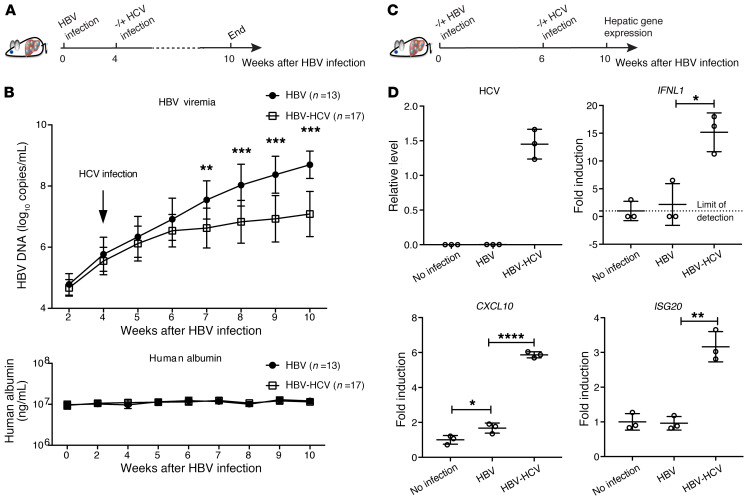
Figure 5. Analysis of HBV-HCV coinfection in cDNA-uPA/SCID mice.
(A) Thirty mice were infected with HBV for 4 weeks before 17 mice were randomly selected for HCV inoculation. All mice were maintained until week 10 after HBV inoculation, as shown by the schematic representation. (B) Serum HBV genome (upper) and human albumin (lower) concentrations were determined at the indicated time. (C) In a separate experiment, 9 mice were engrafted with PHHs from the same donor. Three of them were not infected and served as no-infection controls. Six were infected with HBV and on week 6 after HBV infection, 3 mice were coinfected with HCV until week 10. (D) Normalized hepatic HCV levels are presented as relative levels. Negative HCV RNA was input as 0. Normalized human IFNL1, CXCL10, and ISG20 levels relative to those of no-infection control (set as 1) are shown as fold induction. Details of RT-qPCR can be found in Supplemental Methods. Unpaired t test was used alone (D) or followed by Hochberg’s procedure to correct for multiple comparisons (B). Means ± SD are shown. *P < 0.05; **P < 0.01; ***P < 0.001; ****P < 0.0001.

