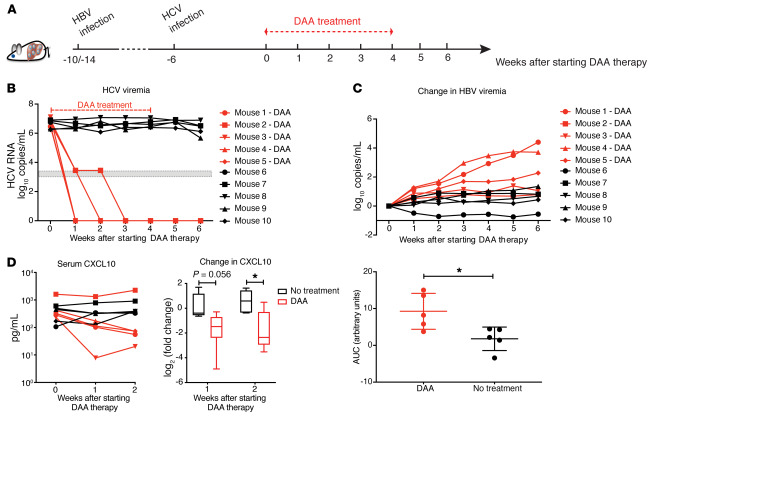
Figure 6. DAA treatment of HBV-HCV–coinfected cDNA-uPA/SCID mice.
(A) Ten mice infected with HBV for 4 (n = 6) or 8 (n = 4) weeks were inoculated with HCV. Six weeks after HCV infection, 5 mice (n = 3, 10 weeks of HBV infection; n = 2, 14 weeks of HBV infection) were treated with daclatasvir (10 mg/kg daily) and asunaprevir (20 mg/kg twice daily) via oral gavage for 4 weeks. Mice were continuously observed for 2 weeks after stopping treatment. (B) Serum HCV RNAs were measured with a lower limit of quantification (3.45 log10 copies/mL) and a lower limit of detection (3 log10 copies/mL) shown as a gray zone on the graph. (C) Changes in HBV viremia (upper ) were calculated by subtracting the baseline levels before DAA initiation from the viral levels at indicated time points. Area under the curve (AUC, lower) for the total change in HBV viremia during the 6 weeks of follow-up was generated by Prism software for individual mice. Means ± SEM are shown. (D) Left: Serum human CXCL10 concentration from mice was measured by ELISA. Right: Fold-change of CXCL10 for each mouse was calculated by dividing its on-treatment levels (week 1 or 2) by the baseline level. Results were grouped based on treatment and are shown in log2 scale. Medians ± 95% confidential intervals are shown. Unpaired t test was used. *P < 0.05.

