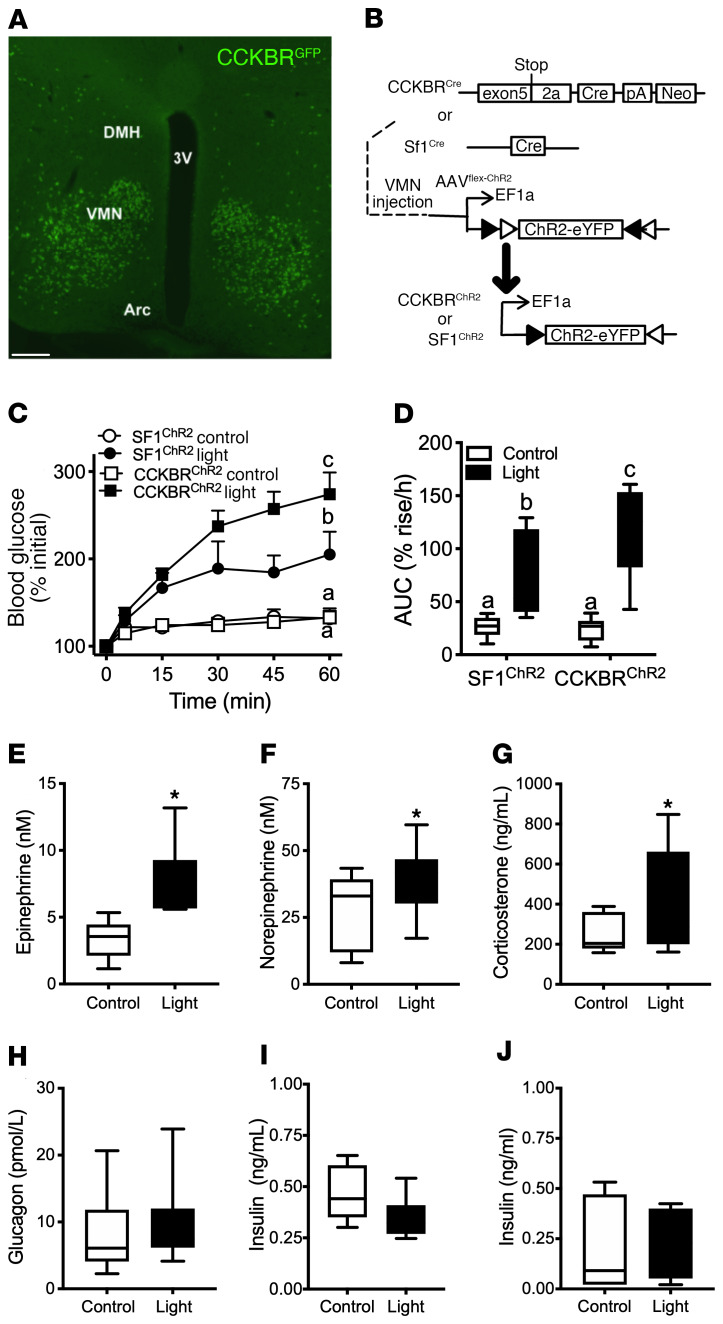
Figure 1. Activation of VMNCCKBR neurons promotes hyperglycemia.
(A) Shown is a representative image of the VMN from CckbrCre animals on the Rosa26EGFP-L10a reporter line stained for GFP (green). 3V, third cerebral ventricle; DMH, dorsomedial hypothalamic nucleus; Arc, arcuate nucleus. Scale bar: 100 μm. (B) Experimental schematic showing intra-VMN administration of AAV-DIO-ChR2-eYFP to CckbrCre (n = 9) or Sf1Cre (n = 5) mice to permit the optogenetic activation of VMNCCKBR neurons or all VMN cell populations, respectively. (C and D) Animals were food deprived at the onset of the light cycle and studied 4–5 hours later. Shown is the glycemic response to control or light delivery, along with the calculated AUC. Plasma samples taken after 30 minutes (E, F, and I) or 60 minutes (G, H, and J) of stimulation in CCKBRChR2 mice were analyzed for circulating concentrations of epinephrine (E), norepinephrine (F), corticosterone (G), glucagon (H), and insulin (I and J). Data are plotted as the mean ± SEM (C) or as box-and-whisker plots that show the data spread from minimum to maximum, median, first quartile, and third quartile (D–J). P < 0.05, by 2-way ANOVA with Fisher’s LSD post hoc test (C and D) (the different lowercase letters in the plots in C and D indicate statistical differences); *P < 0.05, by unpaired Student’s t test (E–I).

