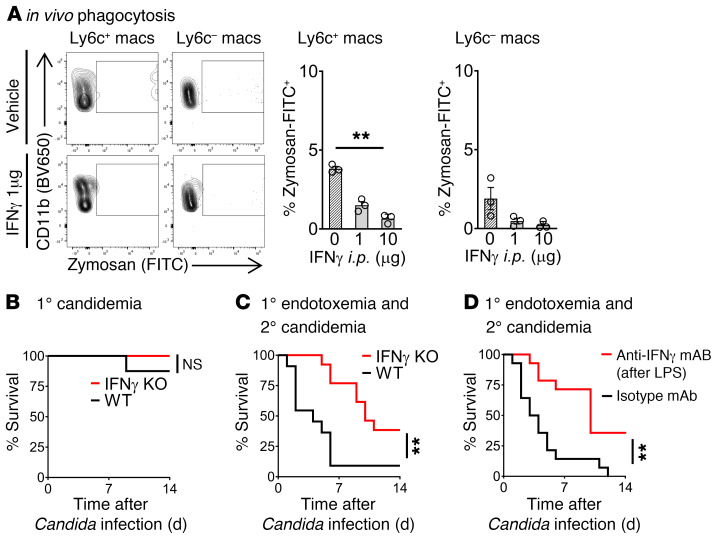
Figure 2. IFN-γ drives post-endotoxemia immunosuppression.
(A) In vivo phagocytosis assay. WT mice (n = 3 per group) received IFN-γ i.p. (or vehicle) followed 18 hours later by opsonized zymosan-FITC i.v. Thirty minutes after zymosan, flow cytometry assessed percentage of splenic macrophages that ingested zymosan-FITC. (B) Survival curve for WT or IFN-γ–KO mice (n = 8 per group) treated with Candida i.v. only. (C) Survival curve for WT or IFN-γ–KO mice (n = 11–13 per group) treated with endotoxemia followed 18 hours later by Candida i.v. (D) Survival curve of WT mice (n = 14 per group) treated with endotoxemia followed by anti–IFN-γ blocking mAb or isotype control mAb at 3 and 15 hours after LPS i.v. Then mice were infected with low-dose candidemia at 18 hours after LPS. In bar graphs, mean ± SEM is shown. (A) One-way ANOVA. (B–D) Log-rank test. **P < 0.001.

