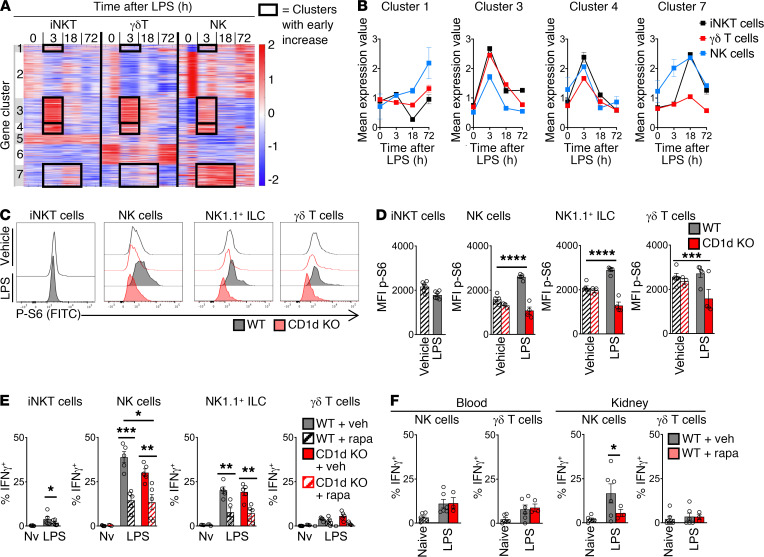
Figure 5. iNKT cells regulate mTOR/IFN-γ in NK cells during endotoxemia.
(A) K-means clustering of RNA-Seq transcriptomic analysis of splenic cell subsets from WT mice during endotoxemia (n = 2, experiment not repeated). (B) Mean expression of transcripts from clusters from A. Expression is increased at 3 hours after LPS i.v. (C) Flow cytometry plots for phosphorylated S6 kinase (p-S6) in splenic iNKT cells from WT or CD1d-KO mice 3 hours after LPS i.v. or vehicle. (D) MFI of p-S6 of splenic cell subsets in C (n = 6 per group). (E and F) WT or CD1d-KO mice were treated with rapamycin (rapa) i.p. (or vehicle) and then 3 hours later received LPS i.v. (or vehicle). Three hours later, mice were given i.p. brefeldin A. At 6 hours after brefeldin, percentage IFN-γ+ cells was assessed by flow cytometry in spleen (n = 5) (E) and blood and kidney (n = 3–6) (F). Nv, naive. In bar graphs, mean ± SEM is shown. (D and E) Unpaired t test. (F) One-way ANOVA. *P < 0.05; **P < 0.01; ***P < 0.001; ****P < 0.0001.

