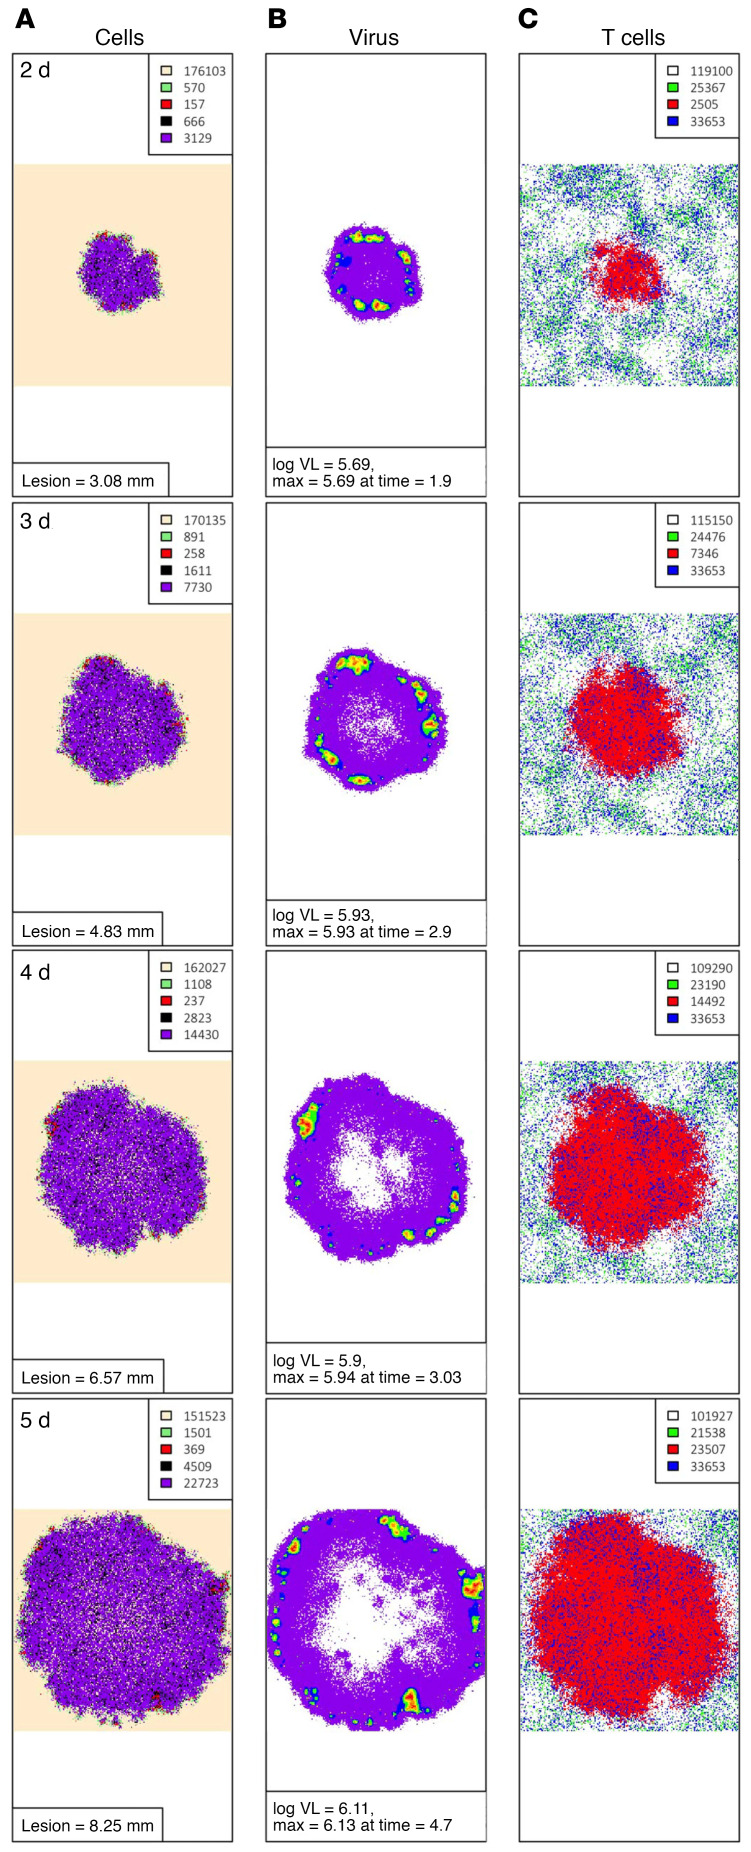
Figure 6. Failed elimination of viral spread in mathematical model simulations in which Trm cells only exert contact-mediated killing.
Breakthrough spatial infection at a high E:T ratio (0.20) in a 5-day simulation that corresponds to Supplemental Video 2 and Figure 5. One-day time steps per row starting at day 2. (A) Preproductively infected cells (green) at the leading edge with a limited inner ring of productively infected cells (red), a core of virally lysed cells (black), and mostly Trm lysed cells (purple cells). Cell counts are shown in the inset. (B) Active HSV-2 replication within isolated intense foci of high local viral loads over regions with actively infected cells. Viral loads (HSV DNA copies) per cellular region: purple, 102–102.25; blue, 102.25–102.5; green, 102.5–102.75; yellow, 102.75–103; orange, 103–103.25; red, 103.25–103.5; dark red, >103.5. (C) HSV-2–specific Trm cell expansion during lesion spread (green, inactivated HSV-specific Trm cells; red, activated HSV-specific Trm cells; blue, inactivated bystander Trm cells). Cell counts are shown in the inset.

