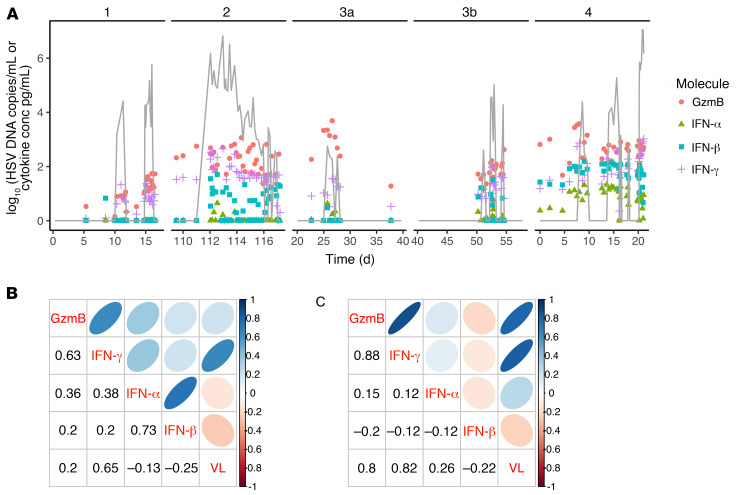
Figure 7. Trm cell–induced IFN-γ and granzyme B production during human HSV-2 shedding episodes.
(A) HSV-2 shedding episodes and mucosal swab cytokine levels in 4 infected persons who swabbed every 8 hours before lesion detection and every 3 hours after lesion detection. HSV-2 DNA, gray line; copies/mL (y axis); granzyme B, pink circles; IFN-α, green triangles; IFN-β, blue squares; IFN-γ, purple crosses, all pg/mL (y axis). Values for both viral load and cytokines are log10 converted. (B and C) Correlations between viral load (VL) and cytokine concentrations from pangenital swabs (B) and lesion-only swabs (C). Numbers indicate Spearman’s coefficients for a given pair aligned by columns and rows. Shapes are graphical representations of these values also aligned by columns and rows (blue, positive; red, negative; narrow and dark, high value; circular and light, low value). For instance, in C, the correlation between granzyme B and viral load is 0.8. Correlations among viral load, granzyme B, and IFN-γ are strong, while correlations with epithelial cell–derived IFN-α and IFN-β are weak or absent.

