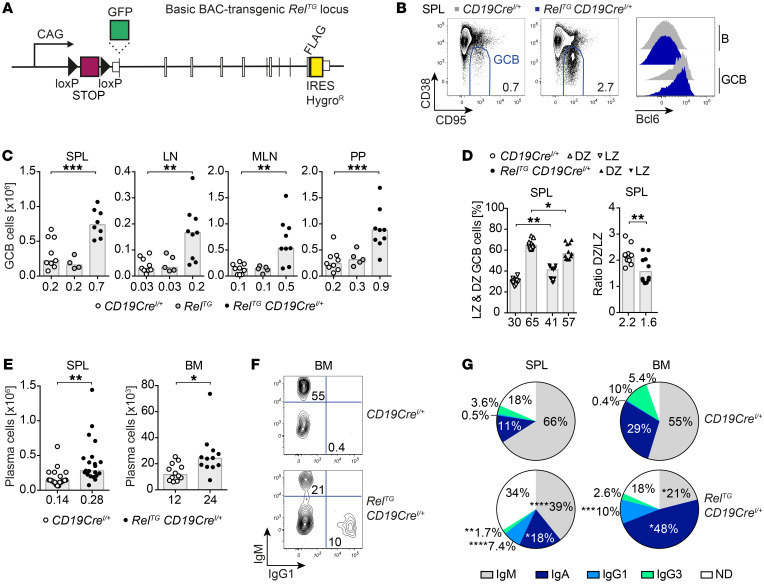
Figure 1. B cell–specific c-Rel overexpression causes spontaneous GCB cell expansion and leads to an accumulation of class-switched plasma cells.
(A) Scheme of the RelTG and GFP-RelTG BAC-transgenic loci. A CAG promoter followed by a loxP-flanked STOP cassette, an N-terminal HA tag or GFP fusion, and a carboxy-terminal FLAG tag were inserted. (B) Representative flow cytometry plots of GCB cells (B220+/CD19+ CD95hiCD38lo). Displayed numbers are median percentages of GCB cells within all B cells (n ≥ 8). Representative flow cytometry histograms of intracellular Bcl6 protein expression. (C) Cell numbers of CD95hiCD38lo GCB cells. Individual data points obtained in 3 or more independent experiments are plotted. Bars and numbers below graphs are median values. **P ≤ 0.01, ***P ≤ 0.001, 1-way ANOVA. (D) Frequencies of light zone (LZ; CXCR4loCD86hi) and dark zone (DZ; CXCR4hiCD86lo) GCB cells and DZ/LZ ratio. Individual data points are plotted. Numbers below graphs and bars are median values for frequencies and geometric means for ratios. *P ≤ 0.05, **P ≤ 0.01, unpaired t test. (E) Cell numbers of CD138+B220lo plasma cells. Individual data points obtained in 6 or more independent experiments are plotted. Bars and numbers below graphs are median values. *P ≤ 0.05, **P ≤ 0.01, unpaired t test. (F and G) Representative flow cytometry plots (F) and pie charts (G) of intracellular Ig isotype staining in plasma cells. Displayed median percentages include data from 8–14 mice analyzed in 5 or more independent experiments. Significant differences with respect to the CD19CreI/+ control genotype are indicated by asterisks adjacent to the respective percentages in the RelTG CD19CreI/+ charts. *P ≤ 0.05, **P ≤ 0.01, ***P ≤ 0.001, ****P ≤ 0.0001, unpaired t test. BAC, bacterial artificial chromosome; HygroR, hygromycin B resistance; SPL, spleen; LN, lymph nodes; MLN, mesenteric lymph nodes; PP, Peyer’s patches; BM, bone marrow; ND, not determined. See Supplemental Figures 1–4.

